The preceding article provides detailed information about many apps for smartphones, tablets and laptops to help ocean voyagers with passage planning. These apps bring the output of mathematical models of the atmosphere to mariners in a useful, widely used format. Since mathematical models are the core of these apps, it is worth discussing the general theory behind them.
The forces that dictate atmospheric motion in three dimensions depend on differing amounts of incoming solar radiation around the globe, the differing nature of the earth’s surface, the rotation of the earth, the temperature and density of air, the changing amounts of water vapor in the atmosphere, and more. The physics can be represented by a series of differential equations with the independent variable of time. High speed computers are used to solve these equations given a well-defined initial condition, which provides an atmospheric forecast.
The models are run on a data grid in three dimensions. The initial state of the atmosphere is applied to this grid, and the output is given at grid points, then analyzed to display patterns of various parameters, including wind speed and direction. Smaller grid spacing generally provides better resolution of atmospheric features, but it also costs computer time since the number of computations required increases.
The representation of atmospheric physics in the models has been refined by research meteorologists and mathematicians over the past half century. More powerful computers are available to run the models and this allows for smaller grid spacing. The result is that the models today are far more accurate than they were a couple of generations ago, and are also able to provide forecast output farther into the future. Forecast models are one of the most powerful tools for meteorologists. These tools are now available to mariners via software apps.
Not perfect
As good as the models are, however, they are not perfect. In order for the equations to be computationally stable, smaller scale features and motions need to be filtered out, but in the real world sometimes these smaller scale features are quite important. Also, the models depend on an accurate set of observations to determine the initial state of the atmosphere. These observations come from surface weather reports from airports, ships, buoys and other points around the world, weather balloons that are released twice daily to gather data and satellite observed data. Often the set of observations is not 100 percent complete, and sometimes critical parts of the weather pattern fall in areas where there are less observations. The initial data set has a great bearing on the validity of model output.
Just as one would not set out to do a boat repair with only one tool, more than one tool should be used when evaluating weather patterns for ocean passages. When using one or more of the available weather apps, it is best to supplement them with other available tools. In particular, there are two significant tools that should be used in conjunction with the apps: knowledge of weather systems, and forecast products produced by meteorologists.
Weather systems
Let’s look at the structure of mid-latitude lows and associated cold fronts and warm fronts.

Cold fronts are boundaries between warm and cold air masses where the cold air mass is advancing and replacing the warm air mass at the surface. As the cold air advances, because it is denser, it wedges underneath the warm air and forces rising motion. Rising air cools and as it does, condensation occurs leading to clouds and showers and often includes thunderstorms. When the temperature difference between the two air masses is greater, and the warm air is very moist, severe thunderstorms with strong wind gusts can occur. Figure 1 shows a simple view of a cold front.
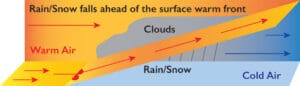
Warm fronts are also boundaries between warm and cold air masses, but in this case the warm air mass is advancing and replacing the cold air mass. The warm air rides up over the more dense cold air mass, but the rising motion is more gradual compared to the cold front. This results in a large area of cloudiness well ahead of a warm front which often results in an area of steady precipitation. Figure 2 shows a typical cross section of a warm front.
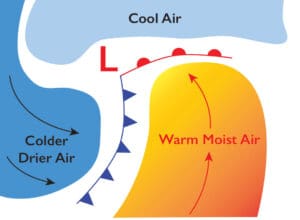
Warm fronts and cold fronts are typically associated with mid-latitude low pressure systems, which possess a counter-clockwise circulation in the northern hemisphere. These lows contain a warm sector, which is a warm air mass located between a warm front and a cold front. The warm front will often extend generally east from a low center while the cold front will often extend to the south or southwest. These directions can vary from one system to another, and also during different phases of development of a low, but in all cases the warm front will precede the cold front. Figure 3 is a simplified look at warm and cold air masses around a northern hemisphere low.
While this discussion of low pressure systems and fronts is brief and simplified, it highlights the weather conditions that can occur with these features. In particular, ahead of the warm front, steady precipitation is likely to occur over a fairly large area, and over the water, this may be accompanied by fog. Closer to the front, and to the center of the low, the precipitation may be fairly heavy, and the fog particularly dense. Ahead of the cold front a narrow band of showers and thunderstorms will often be present which can lead to strong wind gusts along with lightning and heavy downpours. Shifting wind direction as fronts pass can also lead to confused seas.
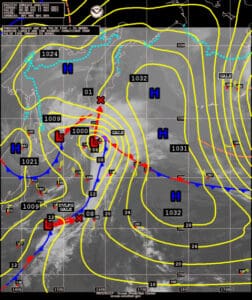
Figure 4 is a satellite image of the western Pacific Ocean with the weather features, including isobars and fronts overlaid. The 1000 millibar low which is evident in the middle of the chart has a warm front extending to its southeast and a cold front extending to its south-southwest. Note the large cloud mass to the north of the warm front and the narrower band of clouds along the cold front. These are consistent with the characteristics of each front and are likely producing precipitation as described above.
When examining the wind field on an app by itself, the weather conditions surrounding fronts may not be apparent. Conditions such as strong wind gusts, limited visibility, lightning activity, and significant precipitation need to be inferred based on one’s knowledge of the characteristics of these features. There are other weather features that can impact mariners as well, including squall lines, troughs of low pressure, occluded fronts and stationary fronts, and the conditions produced by these features may also not be apparent on a display of just wind speed and direction.
Products from meteorologists
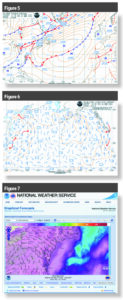
Accessing forecast products produced by meteorologists is an excellent way to supplement the data presentations from weather apps. While the weather apps provide detailed depictions of wind fields generated by mathematical models of the atmosphere, using products such as surface forecast charts produced by NOAA’s Ocean Prediction Center can provide added information, such as the positions of fronts and other features as they progress in time. Together with knowledge about the characteristics of these features, the surface charts allow the mariner to gather more information about the conditions during a passage. Figure 5 is an example of a 48-hour surface forecast chart for the Atlantic.
Center.
The Ocean Prediction Center also produces wind and wave forecast charts. These charts show forecast winds using wind barbs overlaid with the field of significant wave height. In some respects these charts duplicate what can be found on many weather apps. There are two main differences. First, the charts do not show different wind speeds or wave heights with different colors, so they are graphically more simple. Second, and more important, the charts are not generated directly from model data, but rather have the input of a meteorologist. Figure 6 is an example of a 48-hour wind and wave chart for the Pacific.
There are also text forecasts produced by the Ocean Prediction Center as well as local forecast offices for nearshore, offshore and high seas areas. These can be useful to access when offshore where internet bandwidth is more limited.
Another product produced by NOAA’s National Weather Service is the National Digital Forecast Database (NDFD). The Ocean Prediction Center contributes to this product for ocean areas, and it is essentially NOAA’s version of a weather app, except that it is only available through internet access. Figure 7 is an image of NDFD output showing forecast wind speeds, which are color coded. By moving the cursor over the image, wind speed information is shown for the exact location of the cursor. The display can be set to show wind direction, wind gusts or wave heights as well. NDFD output is available through a five-day forecast period. The NDFD is best accessed with a broadband connection, so obtaining it offshore may be difficult. The data presented by the NDFD is not model output, but is data produced by meteorologists.
The question arises: What happens when the data displayed on your weather app of choice is different than what is indicated in NOAA forecasts, whether forecast charts, text forecasts, or the NDFD? Further, what about situations where your weather app displays inconsistent data from different models? First, you should realize that this indicates a less predictable weather pattern. When all forecasts agree, the confidence level is higher. But when there are disagreements, then the forecast will be less certain, and all different scenarios are possible.
In situations where the forecasts do not match up well, it is best to lean toward the human-produced products. It needs to be kept in mind that meteorologists (whether from NOAA, other meteorological services, or private consultants) have access to all of the model data that goes into the weather apps, and in fact to much more data, including from other models that your app may not display. There is no question that the models are powerful tools that are used by all meteorologists today, but the meteorologists also have their knowledge and experience as a tool, and in addition, knowledge about the quality of model initializations (the initial data set for the model) and about how certain models perform in certain situations. These factors sometimes lead meteorologists to deviate from the model generated output to produce a different forecast. Sometimes the differences are subtle, and other times more significant.
Weather apps that display model data are powerful and easy-to-use tools with great value for the mariner. But they should not be the only tool used to make critical decisions.n
Contributing editor Ken McKinley owns Locus Weather in Camden Maine.