For sailors who plan to cruise overseas (including the Caribbean), using satellite imagery is an important subject. Based on our 20 years of experience cruising in the Caribbean, across the Pacific and all over Southeast Asia, we know that commercial charting accuracy away from the U.S. and Europe is not nearly as accurate and detailed as it is in North America. Exclusive use of a chart plotter even with expensive commercial charts can be a big problem if, like many cruisers, you use it to cruise in remote areas.
The main issue is that these charts, though loaded with navigation information, are sometimes accurate and sometimes not, and you never know which is the case. Even if the chart is accurate, often the shoreline detail and nearshore depth indications leave a lot to be desired. Also, as described in the article “More than zoom levels” (Ocean Navigator Nov./Dec. 2017), depending on the zoom level you use, you may not be able to see a small reef or island. So you must be careful with zoom levels using commercial charts. Far at sea these issues are not much of a problem, but nearshore they are more serious.
 Cruisers are still running aground and some losing their boats when using inadequate charting for their cruising area. Recognizing this, the cruising community in the Pacific and Indian Oceans has joined to work on the problem. Many of us out here have been using satellite imagery for our close-in navigation charting with OpenCPN for at least 10 years — our experience with it began with the release of GE2KAP in 2012. The advantages of doing this over using even up-to-date commercial charting are significant. It is less expense, it greatly improves accuracy and shoreline detail, and it lets you trade imagery, waypoints and tracks with other OpenCPN users.
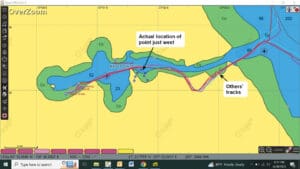
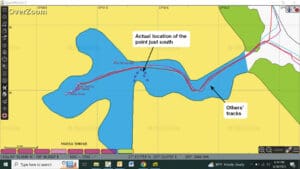
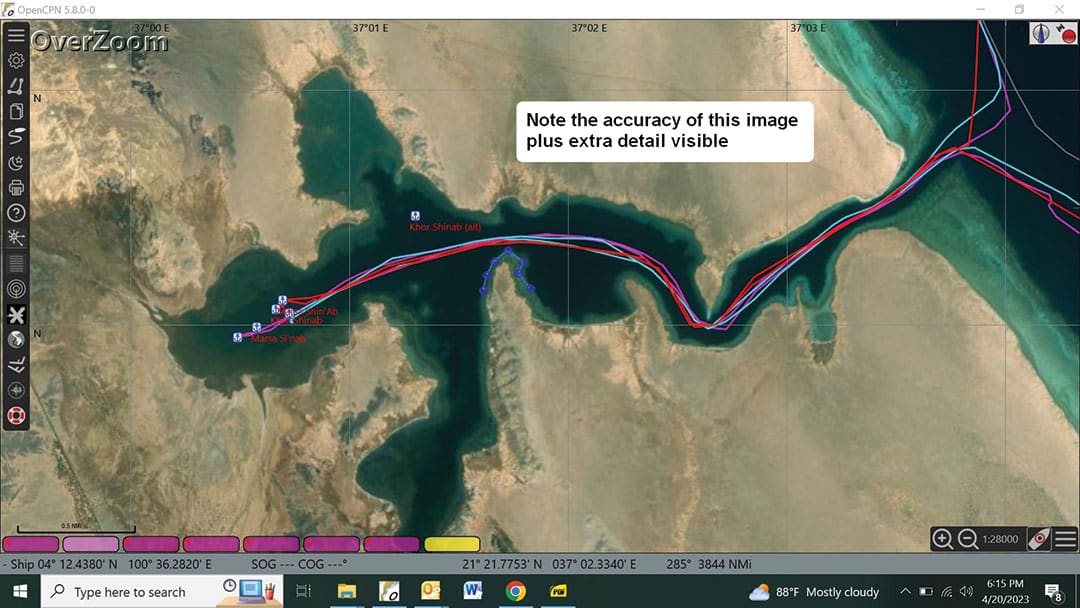
Based on the accompanying pictures on page 38, which chart would you choose? The colored lines on the chart are previous cruisers’ actual tracks into that anchorage, so one can be fairly certain where the good water is.
Several cruisers in the Pacific and Southeast Asia maintain large collections of satellite charts that are shared with other cruisers. The image collections number in the thousands, cover from the Eastern Pacific through the Indian Ocean, plus parts of the Atlantic Ocean and Caribbean, and are continually being enlarged and upgraded. Cruisers’ tracks in and out of many of these anchorages are also available. These cruisers also maintain huge collections of anchorages with information details. All this has been made possible by a former cruiser, Paul Higgins, who in 2012 developed a program called GE2KAP. GE2KAP has now been greatly enhanced and renamed Sat2Chart, with many more options for converting a satellite image to a navigation chart. Besides using satellite images sourced from Google Earth, a cruiser can now choose images from several different satellite sources in order to make the best quality chart.
Also, several of these cruisers have produced detailed guides, with multiple articles and slide show presentations describing the importance of satellite charting for safe off-grid cruising, and how to make the charts. Several of these have been given as presentations in various places and are listed in the links below.
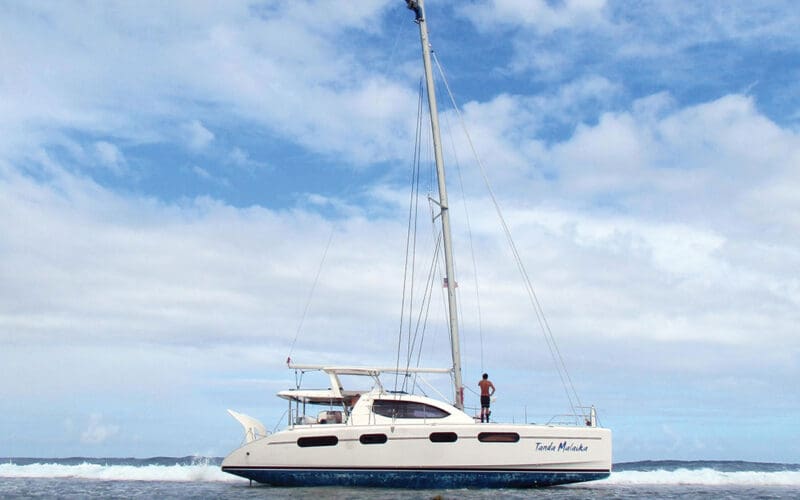
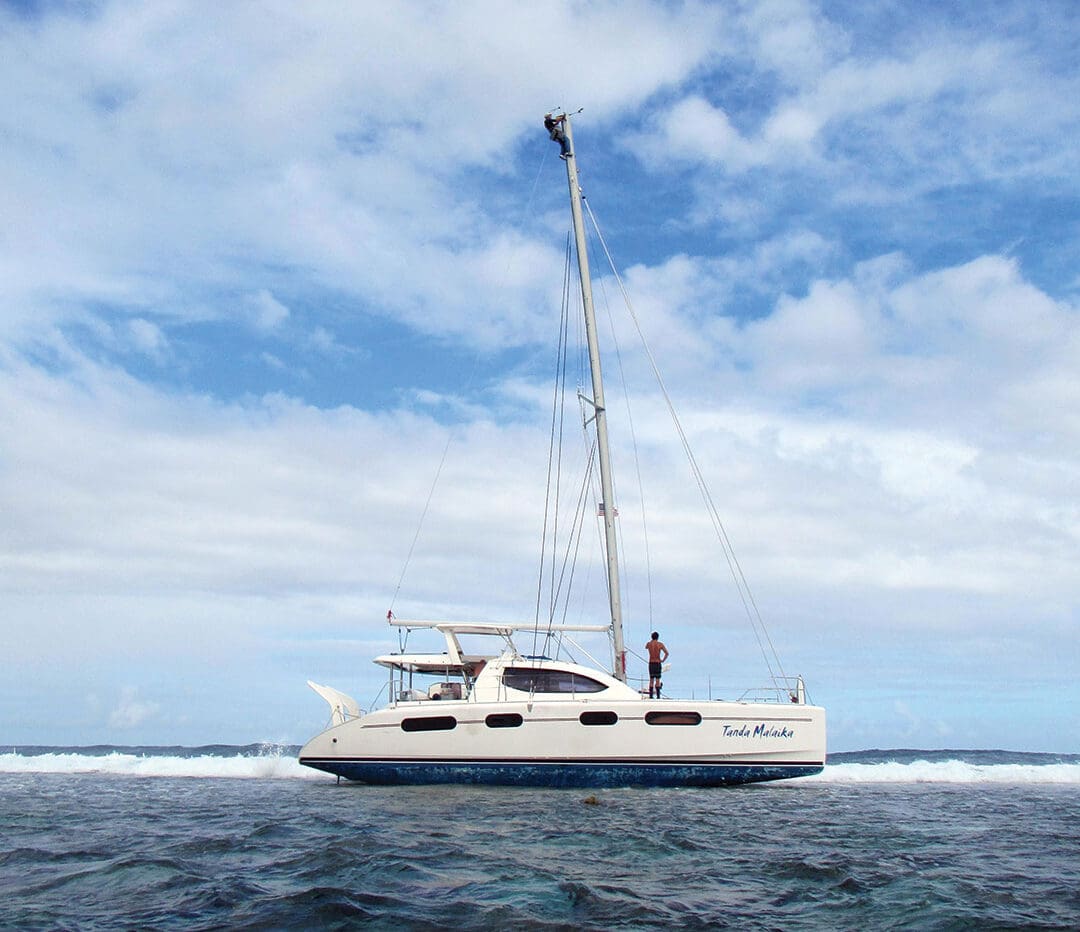
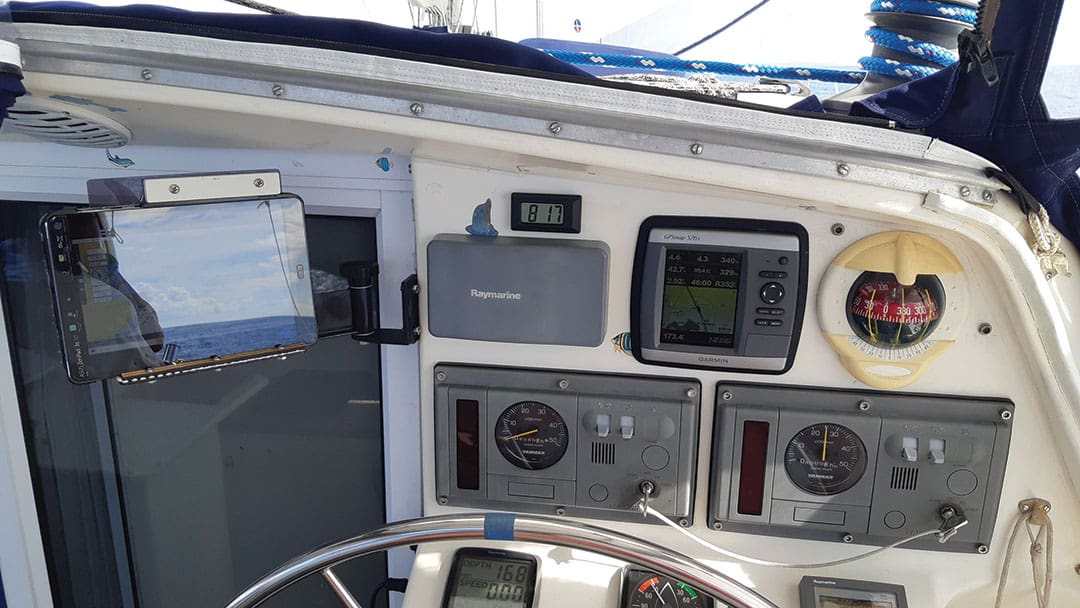
On our boat, Soggy Paws, St. Francis 44 Mark II cat, we have a small chart plotter at our helm station. We like that it is weatherproof, user friendly and that we can see the bottom profile and type with its included depth sonar. Because of the issues with its charts in lesser-traveled areas, we rely on it mainly offshore and when anchoring.
Typically we lay our route using OpenCPN on the below-deck nav station computer. This computer is populated with anchorage waypoints and other cruisers’ tracks, as well as both conventional and satellite charts. Once we are satisfied with the planned route, we then export it and associated anchorages, as a gpx file to our Garmin chart plotter at the helm station. This gives us an accurate and safe route to follow right at the helm. Now we don’t have to worry about the accuracy of its charts. In tight nearshore situations, we make sure that we have the satellite imagery with others’ tracks, our planned route, and possible alternative anchor spots on OpenCPN running on both our navigation station computer and also on our tablet at the helm station. With the tablet running we don’t need to leave the helm to refer to our satellite charts.
Commercial vector charting is usually based on various government data that may suffer from historical, datum and sometimes digitizing inaccuracies. Here in Southeast Asia, we are in the habit of warning new cruisers coming into the area to be careful using only their chart plotters or tablet applications, and learn to use OpenCPN with satellite imagery as an important supplement to whatever charting system they are using.
Sample satellite charts.
As an example of what is currently available, a list of satellite charts we have made for our upcoming trip through the Red Sea have been uploaded to our website at svsoggypaws.com/SatCharts/index.htm for anyone to download. There are many more also listed there for areas of Southeast Asia and the western Pacific.
In general, charts made before 2020 are KAP files; those from 2020 and later are mbtiles. The mbtiles format was introduced into OpenCPN and Sat2Chart in 2019. It provides greater color variation, and therefore much better detail at lower levels.
To save the sample zipped Red Sea files from our website to your local hard drive, right-click on each file, select “Save As,” and save to your chart directory. Then unzip them. The tracks and waypoint files, once unzipped, can be easily imported as “layers” using OpenCPN’s Route and Waypoint manager.
This link takes you to our website with additional detail on installing and using satellite charts: https://svsoggypaws.com/SatCharts/
Cautions using satellite charts.
Satellite charts made using Sat2Chart are homemade charts taken from Google Earth and other satellite imagery (Bing from Microsoft, ArcGIS from ESRI, etc.) You should not trust your boat’s safety to these charts alone without other corroborating evidence such as your own eyes, other charts, cruisers’ tracks and waypoints, depth sounders, etc.
Properly made satellite imagery charts are in general accurate and detailed. They display much shore line and shallow reef detail, especially once you learn how to read the depth colors. However, cruisers must familiarize themselves with reading the charts and learning to correctly interpret what the color of the satellite picture implies.
Additional notes and cautions regarding these home-made charts are:
1. Always cross reference accuracy with known waypoints before you trust home-made charts. And always back up this new technology with visual sightings. Early KAP charts had problems with skewed and misplaced charts. But the latest versions of Sat2Chart have eliminated the source of most of these errors. Still, it’s wise to be cautious.
2. Sometimes satellite images are of poor quality due to low sun angle or clouds. So it is best to review multiple satellite chart sources and pick the best one for the area you are planning to cruise.
3. Very rarely satellite images may have remote reefs missing or painted out. So don’t assume an empty fuzzy expanse on a satellite image is really empty. For example try to find South Minerva Reef, Rose Atoll, and Fonua One One (Tonga, South Vavau Group) on a Google Earth chart. This is why it’s important to cross reference satellite charts with one or more sources of other charts.
4. In areas with small patch reefs, we have noticed that sometimes clouds form right over the reefs and small islands. You might think that’s just a cloud, but there’s a possibility of something solid underneath caused by the shallow reef warming the air above. Always be suspicious of clouds on satellite imagery as you can’t see below them.
5. We no longer use the Google Earth program as our standard imagery source, but instead are using the program SAS.Planet. SAS.Planet makes it easy to quickly check imagery from several sources, including Google.
6. The best download source for a known stable version of SAS.Planet, configured to work well with Sat2Chart is Paul Higgins’ (the GE2KAP/Sat2Chart developer) download folder here: www.gdayii.ca/Downloads/
7. Download the SASPlanet.zip file, unzip it and put the unzipped folder on your main drive (no “installer” needed). Make a shortcut to SAS.Planet.exe and put that on your Desktop or Start menu.
8. Most cruiser-made charts were made with Sat2Chart (formerly known as GE2KAP), a free utility available on the internet. The developer continues to put hundreds of hours per year into development and expansion of this tool. His website is here: www.gdayii.ca/index.php
9. Likewise, the OpenCPN development team, an all-volunteer group of very dedicated programmers, also spends many hours adding useful features to the still-free OpenCPN navigation program. Their website is here: opencpn.org.
Working with multiple chart sources
Once you have installed the charts for use by OpenCPN, make sure you have “show chart outlines” display option turned on. (Shortcut: typing “O” on the keyboard toggles to show and hide chart outlines). You should then see red chart outlines for the areas of charts you have added.
You should also see blue, pink, and yellow/brown bubble/bars at the bottom of the chart area. These will change as you move the chart around and zoom in and out. These designate the available charts. The left-most bubble represents the most detailed chart available, scale-wise. The right-most bubble is usually the CM93 world-wide chart.
If you have “chart quilting” turned on in OpenCPN, toggle the light blue bars (KAP files) and pink bars (mbtiles) at the bottom of the screen to see which level of chart you can choose. The left-most bars on the bottom of the chart table are the most detailed charts, and the right-most are the least detailed.
The easiest way to zoom in and out is with the + and – keys on your keyboard, or mouse wheel.
OpenCPN has excellent help files, and there is an OpenCPN User group on Facebook, as well as a support forum on CruisersForum.com.
In addition to all the reasons stated above, there are some added benefits to using OpenCPN that include the following very useful plugin applications that will aid in your passagemaking:
Climatology consisting of wind rose or wind barb display Pilot Charts with wind, current and tropical storm tracks averaged since the 1980s and overlaid on your chart.
Radar overlay for Garmin, Navico, and Raymarine digital radars.
Weather routing looks at historical weather and current data to help you plan a future voyage.
Polar file creates polar (performance) files for your boat from actual data as you sail.
Voyage data recorder records and displays boat data from onboard sensors.
Stowage manager allows a cruiser to create an onboard stowage file by location.
Logbook function lets you digitize your official daily logbook.
NMEA instrument displays your course, speed, wind, depth, etc. on your computer, tablet or cell phone.
And there are many more, with new plugins being developed every day. Check out the plugin section of the OpenCPN website for more details.
Resources
For more information on this important subject, below is a link to a collection of Power Point slide presentations on our website that cover electronic navigation, OpenCPN, satellite charts and passage planning in detail. https://www.svsoggypaws.com/presentations.htm
We hope the above information will help international cruisers learn to use satellite imagery with OpenCPN in order to improve their navigational safety in remote areas of the world. n
Dave McCampbell is a former US Navy officer who spent most of his time as a diving and salvage officer. He and his wife Sherry voyage on their St. Francis 44 Mark II cat Soggy Paws.