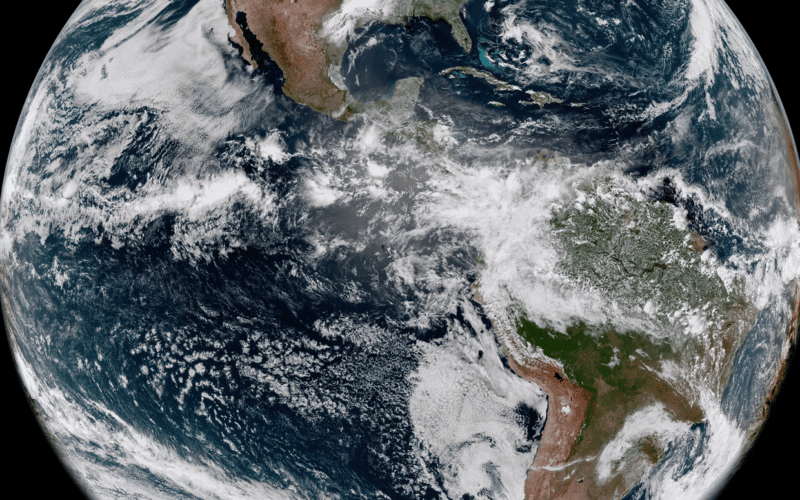
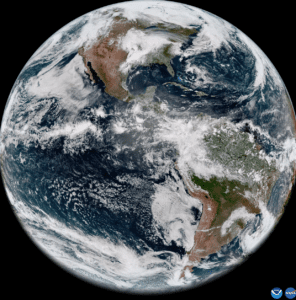
 NOAA released a photo today from its latest Geostationary Operational Environmental Satellite (GOES), GOES-18. The image shows the Western Hemisphere from 22,236 miles out into space. GOES-18 was launched on March 1, 2022 from Cape Canaveral, Florida. This latest version of the GOES line has an Advanced Baseline Imager (ABI) instrument that can see Earth using 16 different channels, each measuring energy at different wavelengths along the electromagnetic spectrum. This allows the satellite to gather data about Earth’s atmosphere, land, and ocean. This is good news for voyagers, as better imagery translates into better marine forecasts.
From the press release: “GOES-18 is currently undergoing post-launch testing, validation and calibration of its instruments and systems to prepare it for operations. The ABI cooling system is performing well, with no signs of the issue that affects its sister satellite, GOES-17. The ABI was redesigned for GOES-18 to reduce the likelihood of future cooling system anomalies. The new design uses a simpler hardware configuration that eliminates the filters that are susceptible to debris.
“GOES-18 will assist GOES-17 with GOES West operations in late summer 2022 and again in early fall. NOAA plans for GOES-18 to replace GOES-17 as GOES West in early 2023. Imagery from GOES-18 during the post-launch testing phase should be considered preliminary and non-operational.
 “This GOES-18 image shows the contiguous United States observed by each of the ABI’s 16 channels on May 5, 2022. This 16-panel image shows the ABI’s two visible, four near-infrared and 10 infrared channels. The visible and near-IR bands are gray-colored, while the infrared bands have the warmer brightness temperatures mapped to warmer colors. The different appearance of each band is due to how each band reflects or absorbs radiation. Each spectral band was scanned at approximately the same time, starting at 18 UTC.
“The ABI provides high-resolution imagery and atmospheric measurements for short-term forecasts and severe weather warnings. ABI data is also used for detecting and monitoring environmental hazards such as wildfires, dust storms, volcanic eruptions, turbulence, and fog.
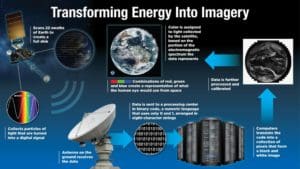
Data from multiple ABI channels can be combined to create imagery that approximates what the human eye would see from space—a result known as GeoColor. Combining data from different channels in different ways also allows meteorologists to highlight features of interest.”