 As has been long reported by this magazine and others, NOAA’s on-going policy is to eliminate traditional paper charts. At the end of 2024, NOAA will no longer update traditional paper chart products. A type of electronic chart c
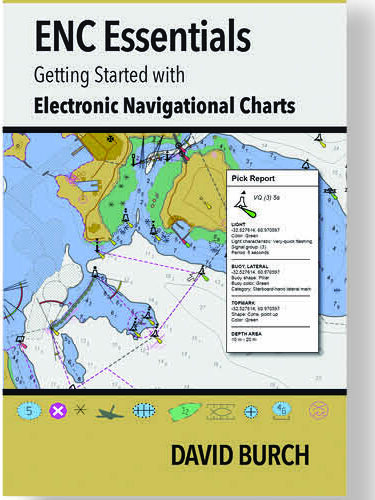
alled the Electronic Navigational Chart (ENC) will be the only official chart product available to recreational mariners. To buffer the transition to all-electronic charts, NOAA has created a new online app called NOAA Custom Charts (NCC) that mariners can use to make a backup paper chart of their own design based on the ENC. The app creates a PDF, which users print on their own. But this remains a significant change in charting and the more voyagers understand the ENC format, the better for their voyaging navigation. Based on this, David Burch of Starpath School of Navigation in Seattle has produced a new 49-page booklet explaining the ins and outs of this electronic chart standard, ENC Essentials, Getting Started with Electronic Navigational Charts. The booklet is loaded with in-depth detail on ENCs and how to use them.
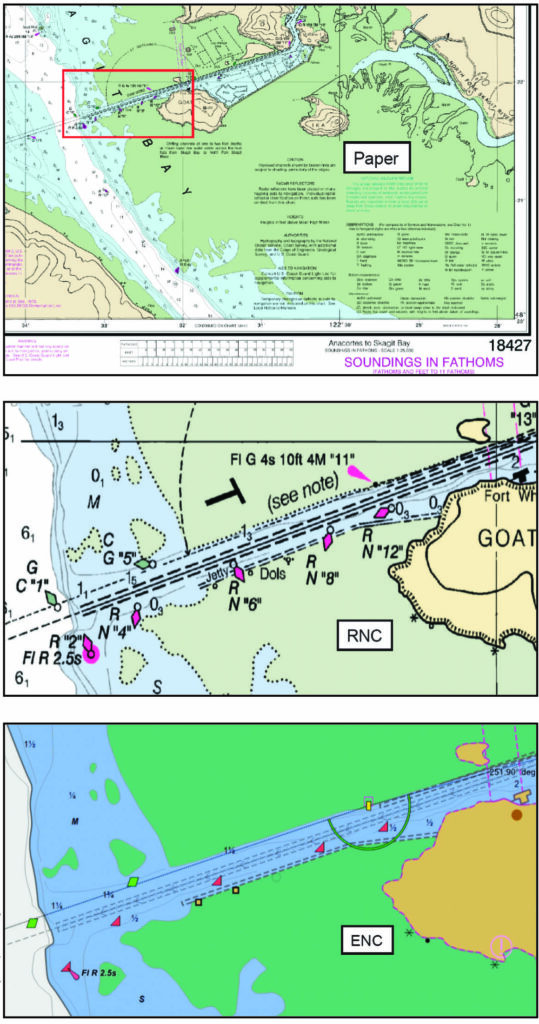
Before we get into a review of Burch’s book, let’s look at how we got here. The ENC format is only one flavor of digital chart. An earlier type of electronic chart is called a raster chart (a raster image is a bitmap or grid of square pixels stored as a sequence of lines). These raster charts were the first step in turning paper into digits. NOAA took its paper chart inventory and scanned them into digital files (using a really big high-resolution scanner!) A raster chart was a high-definition image file of a particular paper chart. They had the advantage of looking exactly like the paper charts voyagers were used to using. The disadvantage with a raster chart is that it is a frozen picture of the chart. The presentation of the elements on the chart can’t be changed. And when you zoomed in to a particular area, you were enlarging the picture so the symbol for a buoy, for example, might take up half the screen.
Raster charts were a useful first step in starting the transition away from paper. But their drawbacks were immediately apparent. Another type of electronic chart was developed based on the concept of vector graphics. Unlike a fixed grid of pixels like a raster image of a coastline, a vector graphics image is a set of instructions on how to draw lines at specific angles and lengths to represent the same coastline.
The great advantages of a vector chart are that 1) the data can be broken down into layers that the user can toggle on and off, and 2) editing the georeferenced data is much easier and more precise than editing a raster chart.
In the commercial world, vector charts were made the standard years ago. Commercial vessels use ENCs, but how they are displayed is based on the International Hydrographic Organization (IHO) S-52 standard; ships are required to display their charts on an IHO-compliant electronic chart display and information systems (ECDIS) device. Recreational vessels employ ENCs displayed on computers or tablets, chart plotters, and MFDs using application programs called electronic chart systems or ECS.
As vector charts, ENCs have many layers of data that a user can choose to see or to hide. This can be a useful tool, but it can potentially get a voyager into trouble if he or she turns off data that might prove useful for a particular situation. The value of Burch’s short book is that it provides voyagers with all the information they need to understand and fully utilize ENC charts so they can make smart decisions about how to filter the data they’re viewing. The book covers how ENCs are put together, how they’re numbered, display modes and minimum scales for displaying chart features, the symbols used, ENC charting scales and more.
ENC charts do look different than paper charts or raster charts. They differ in the way they depict land, chart symbols like buoys, the widths and types of lines, and even the colors used. ENC users have the option of using two different styles of symbols, either “paper chart” or “simplified.” This seems like a great solution to the look and feel issue, however, the “paper chart” style symbols don’t actually look like the symbols on a paper chart! Another area of difference is the lack of detail shown on land areas. According to Burch, NOAA is working to include more of this detail in future versions.
In the past, when you looked at the electronic NOAA chart catalog of existing ENCs, it was a quilt of different chart coverage areas broken up into areas with jagged outlines that seemed almost arbitrary. In the new versions of ENC, NOAA is doing something called rescheming. As Burch writes in his booklet, “This replaces the irregular borders and file names with rectangular borders of fixed aspect and consistent scales with systematic names.”
Burch also points out that ENCs fit very well with the added features and capabilities that can be plugged into them when using an ECS. These include waypoints and routes, tides and currents, weather overlays and sailboat route planning, among others. Many ECS programs can calculate the optimum route to sail based on wind and wave data and then display that route on an ECS chart.
There are few voyagers who won’t learn something from this booklet. It provides a solid base of knowledge for getting the most from ENCs. n