Even in the age of high-speed internet at sea, remarkable weather model forecasts, and satellite wind measurements, our knowledge of the correct atmospheric pressure, and how it changes with time, remains the key to safe, efficient routing decisions. Pressure data are also the most direct means of evaluating the model forecasts that we ultimately rely on for routing.
Productive barometer use in navigation is a relatively new concept — it was actually used more effectively in the 1700s than in the 1900s. The Barometer Handbook explains its interesting history and its role in marine navigation. The major change came when accurate, affordable digital barometers started to find their way onto boats. Now we have many options. Chances are the barometer in your phone is the most accurate barometer on the boat, and the easiest to use with a good app. Several options for mobile devices and computers are listed at starpath.com/marinebarometer, which also includes a link to an extensive set of barometer resources.
Phone barometers are typically accurate to better than ± 2 mb right out of the box, and it is relatively easy to improve on that with online resources given in the link above. The goal would be to get its accuracy down to < 1 mb, which is the effective standard used in the buoy and ship reports shown on surface analysis maps. Map pressures and forecasts give the pressures to a precision of 0.1 mb, so we can make comparisons on that level, keeping in mind the overall uncertainty.
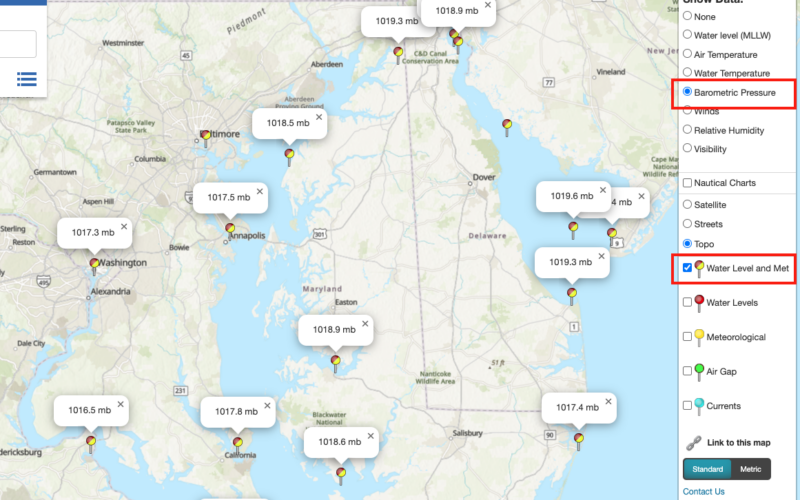
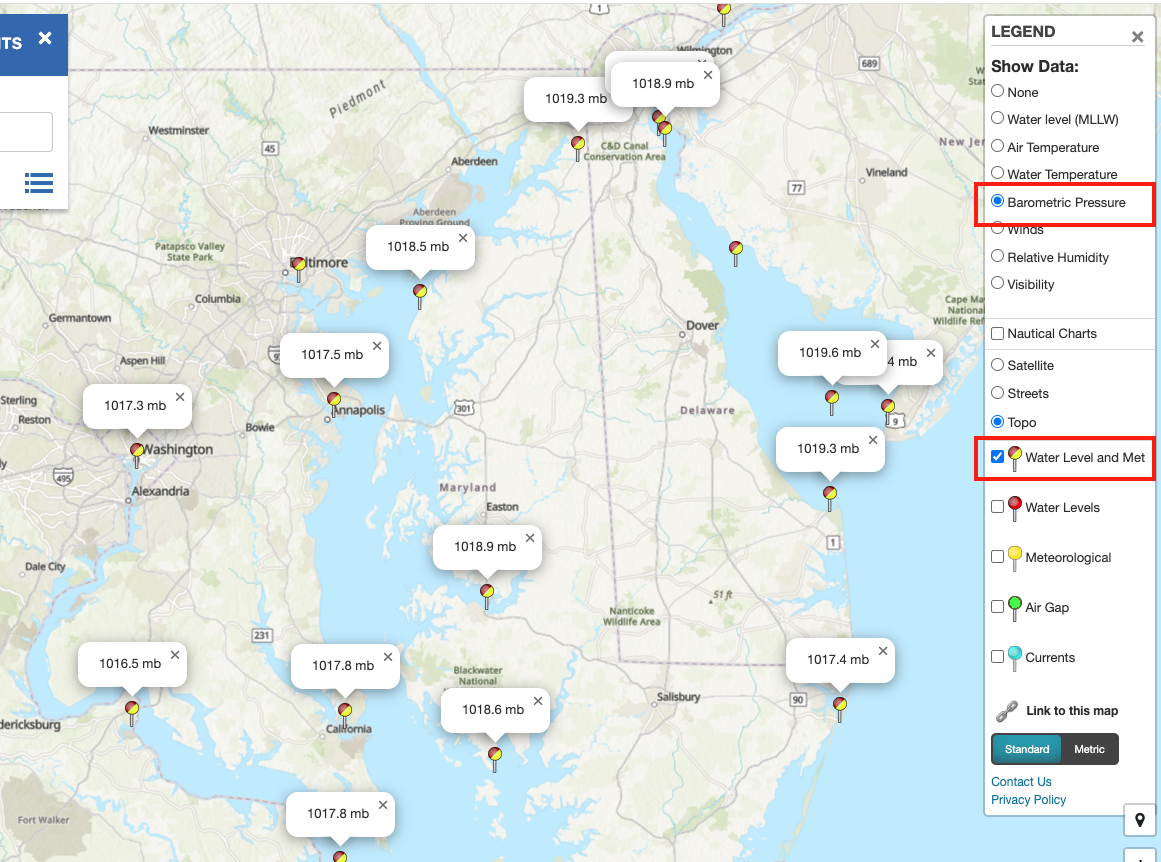
Unlike aneroid barometers, modern sensor accuracies do not vary much (just a few tenths) over the full pressure range we expect at sea — 940 mb to 1040 mb, always hoping to avoid the two ends. Thus, setting it to the right pressure at any value is effectively calibrating it over the full range. One fast way to calibrate in U.S. coastal waters is to make regular comparisons with National Oceanic and Atmospheric Administration stations accessed through tidesandcurrents.noaa.gov. Procedure: (1) Go to the site and click your state. (2) Turn on Barometric pressure on the right. (3) Zoom in to find two pressures to interpolate between. (4) Consider this to be the correct sea level pressure (SLP) at the moment, compare this to your barometer reading, and record the difference in a logbook. These data are updated every 6 minutes.
Remember your pressure will be lower than the sea level value even if your barometer is spot on because you are at some height above sea level. Precise corrections are in the resources cited above, but you can compute the correction with the jingle, “Point four four per floor,” which means the pressure drops 0.44 mb for each 12 ft above sea level. Correct your reading for your height before comparing the two.
With a calibrated barometer we are ready to tackle some weather applications. Many ocean sailing routes go around highs because there is no wind in the middle of the highs. We may be following a rule of thumb, such as stay two isobars (8 mb) off the central pressure, or we might be following a computed route that often takes us dangerously close to the high. In any event, knowing how the high is moving is crucial information. With a good barometer you can tell if the pressure is rising or falling very quickly, because the instruments can dependably show steady changes of just a few tenths of a mb.
When interpreting any pressure change, we need to keep several things in mind. The pressure will go up if the high is indeed moving toward us, or if it is not moving, and we are sailing toward it. It can also go up if neither one of us is moving, but the high is just building. So, we need to watch our track on the chart compared to the isobars on the chart from the model forecast we are using to properly interpret changes detected. At lower latitudes, we also must correct for the semidiurnal variation of the pressure caused by a tidal effect in the atmosphere. It is a variation of about ± 1.7 mb, with two highs and two lows daily. Check out a pressure plot from any ndbc.noaa.gov station in the tropics to see the pattern.
A good barometer is especially valuable when sailing in waters prone to tropical storms, because the standard deviation of the pressure is low in these waters — typically 2 mb or so. When sailing there for some time, you will know the mean ambient pressure for that time and place (after correcting for semidiurnal variation), which might be about 1013 mb. Then when you observe the average pressure drop to 1009, you know this is almost certainly the approach of a tropical storm, even if the wind or clouds have not signaled it. A drop of 2 standard deviations has only a 2.3% chance of being a statistical variation of the pressure. This does not work at higher latitudes because the standard deviations are much larger.
As a general guideline to the interpretation of pressure drops at any latitude, we suggest the rule “4-5-6” meaning any change of 4 or 5 mb over a 6-hour period is fair warning that bad weather might be headed your way. Not guaranteed, just a guideline to practice with to see how well it works for you. Drops of much less than that do not usually signify anything, and much more than that often puts you past the realm of forecasting. It is there. With a good barometer we can monitor this guideline precisely.
Beyond those couple examples of pressure as forecaster, a key role of the barometer these days is for evaluating numerical forecasts. Remember, there will always be a model forecast, and they are not marked good or bad. It is up to us to evaluate the forecast in every way we can before setting routes based upon it. We would also do this with the wind speed and wind direction, but both have several corrections to apply, plus they rely on instruments that are difficult to calibrate accurately. With the barometer we can know before we leave the dock that our barometer is spot on, and then we are just comparing two numbers.
For this evaluation, we need to log the measured pressure at least at every synoptic time (00, 06, 12, 18 UTC). We then look back over our track on the screen to where we were at the synoptic time and compare our pressure to what the forecast says. If the pressures agree within a mb, we have a hopeful sign the forecast could be right, but we learn more if they notably do not agree. Then we know the forecast is wrong on some level. With practice we can likely piece together, including using the wind data, how it might be wrong—i.e., too early, or too late; isobars rotated, Low or High deeper than forecasted, and so on. The barometer gives us one clean, indisputable data point to use.
David Burch is the Director of Starpath School of Navigation in Seattle (starpath.com). He is author of Modern Marine Weather and The Barometer Handbook, and developer of the Starpath Marine Barograph app for phones and tables and the Starpath USB barometer for computers.