Weather conditions along the U.S. West Coast have made many headlines from last summer through this past winter and into the spring. Last summer it was the severely dry weather followed by one of the worst fire seasons in recent memory; then, into the winter, the focus was strong storms slamming into the coast and producing large amounts of rain, which led to killer mudslides in many areas as it fell on landscapes that had been stripped of vegetation. These storms were part of a pattern popularly called the “Pineapple Express,” where a so-called “atmospheric river” transports large quantities of moisture into the western U.S.
The Pineapple Express showed up again briefly in early April 2018, and while this pattern was not one of long duration, it is still worth looking at the charts as the pattern evolved and noticing not only how the rainfall makes it into the western U.S., but also how the eastern Pacific Ocean is impacted.
 |
|
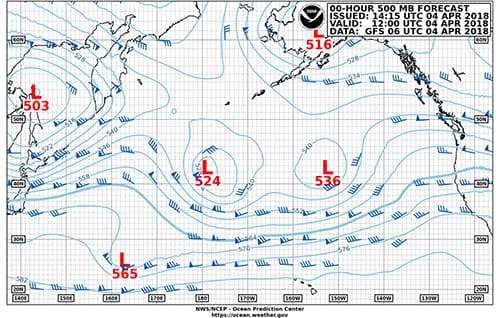
Figure 1: Pacific 500-millibar analysis chart valid at 1200 UTC 4 Apr 2018. |
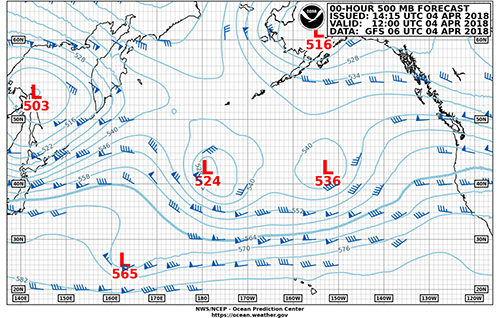
As with most systems in the mid-latitudes, the place to start looking is the 500-millibar charts. Figure 1 is the Pacific 500-millibar analysis for 1200 UTC on April 4, 2018. Notice two closed lows just north of 40° N — one near the dateline and another just west of 150° W. Also notice that the iso-height lines are oriented in an east-west fashion to the south of these lows. Twenty-four hours later at 1200 UTC on April 5, 2018 (Figure 2), the eastern closed low has moved northeast and the western low has shifted east-southeast, resulting in the flow pattern becoming oriented in a west-southwest to east-northeast direction from north of Hawaii toward the western U.S. This is the start of the Pineapple Express pattern. Notice also that the iso-height lines have become closer together from Hawaii’s longitude eastward, resulting in wind speeds of at least 80 knots in some areas — noticeably stronger than was the case 24 hours earlier. This indicates increasing energy at the 500-millibar level.
 |
|
Figure 2: Pacific 500-millibar analysis chart valid at 1200 UTC 5 Apr 2018. |
Also in Figure 2, notice that there is a sharp curvature in the iso-height contours extending south-southwest from the low at 37° N, 167° W to about 30° N, 171° W. This is a trough axis, which would have been indicated by a dashed line on the chart until a change in the format of the charts late last year. The trough position is important because it typically gives a strong indication of where developing surface low pressure will be located, generally downstream from the 500-mb trough axis. The progression of the trough helps to determine how the surface low will track. Looking back at Figure 1, the trough axis is harder to locate, but is likely along about 176° W or so.
 |
|
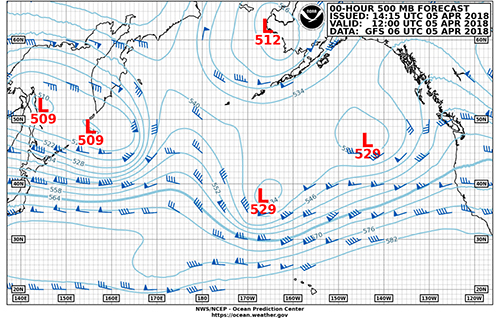
Figure 3: Pacific 500-millibar analysis chart valid at 1200 UTC 6 Apr 2018. |
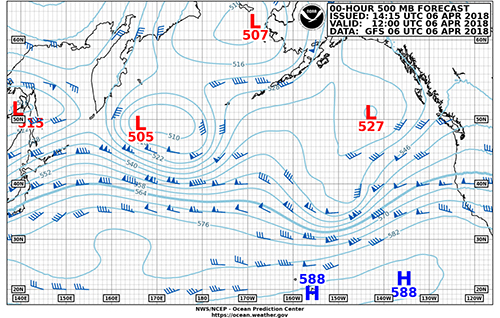
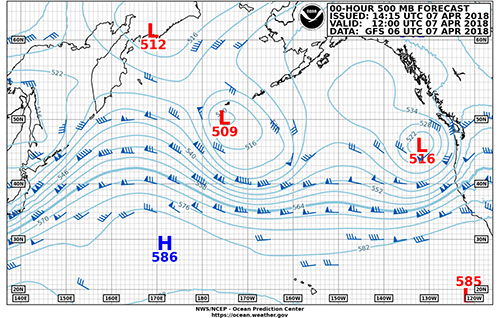
Looking forward now, Figure 3 is the 500-millibar analysis for 1200 UTC on April 6, 2018, and the closed low associated with the trough is less evident with an “L” no longer on the chart; but, it is located at about 40° N, 150° W, and the trough is rather vigorous as indicated by wind speeds of over 100 knots in the tight iso-height field to the east of the trough axis, which has progressed to the east of 150° W. Figure 4 is the 500-millibar analysis for 1200 UTC on April 7, 2018, and the 500-mb low associated with the trough has become much stronger and is located west of the northwestern U.S. with the trough axis likely near 130° W to its south. Note that the other closed low has migrated north into the Gulf of Alaska and is not shown with an “L” anymore but is clearly enclosed by the 534dm iso-height line.
 |
|
Figure 4: Pacific 500-millibar analysis chart valid at 1200 UTC 7 Apr 2018.
|
 |
|
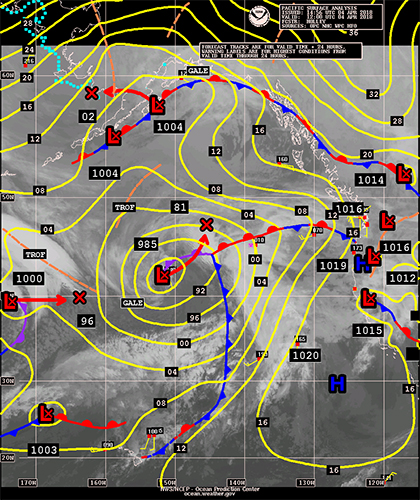
Figure 5: Eastern Pacific surface analysis chart with satellite overlay valid at 1200 UTC 4 Apr 2018. |
The progression of the 500-millibar pattern suggests increasing energy propagating from north of Hawaii toward the western U.S., and we would expect to find low pressure downstream of the trough axis, strengthening as it moves with the flow toward the West Coast. Figure 5 is the surface chart overlaid with a satellite image for 1200 UTC on April 4, 2018. While there is a large low producing gale-force winds north of 40° N, it is the small weaker low near 25° N, 170° W, that we will want to watch. Figure 6 is the surface chart for 1200 UTC on April 5, 2018, and the southern low has moved east-northeast to about 30° N, 155° W. The arrow extending east-northeast from the low shows the projected 24-hour movement, generally in the direction of the 500-mb flow. Also evident on this chart is a well-established plume of moisture from north of Hawaii toward the western U.S. — a hallmark of Pineapple Express events — and there is another low center farther to the northwest just to the east of the 500-mb low center.
 |
|
Figure 6: Eastern Pacific surface analysis chart with satellite overlay valid at 1200 UTC 5 Apr 2018.
|
 |
|
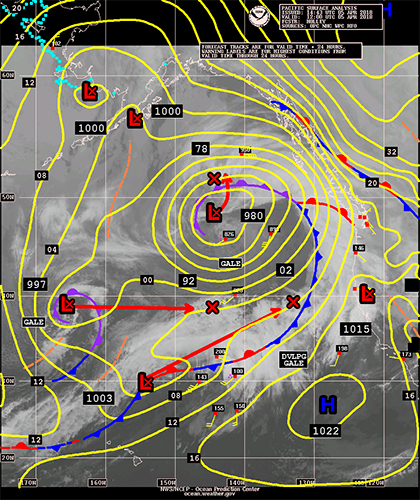
Figure 7: Eastern Pacific surface analysis chart with satellite overlay valid at 1200 UTC 6 Apr 2018. |
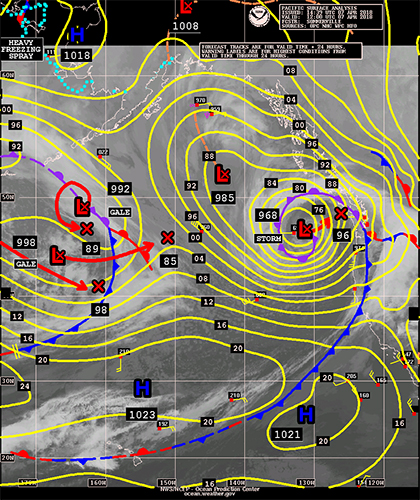
Figure 7 is the surface chart for 1200 UTC on April 6, 2018, and the low has continued quickly east-northeast with the low east of the 500-mb low center also moving quickly east and becoming stronger. Rapid strengthening of this low is forecast, and Figure 8 shows the surface chart for 1200 UTC on April 7 with the intense low located west of the northwestern U.S. and its central pressure having dropped more than 20 millibars in 24 hours. The moisture associated with the first low has moved into the western U.S. by this time, and it has been absorbed into the circulation of the offshore low. Very heavy rainfall impacted central and northern California from this system.
 |
|
Figure 8: Eastern Pacific surface analysis chart with satellite overlay valid at 1200 UTC 7 Apr 2018.
|
 |
|
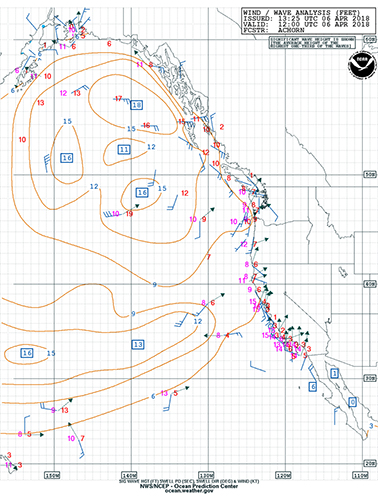
Figure 9: Eastern Pacific wind/wave analysis chart valid at 1200 UTC 6 Apr 2018. |
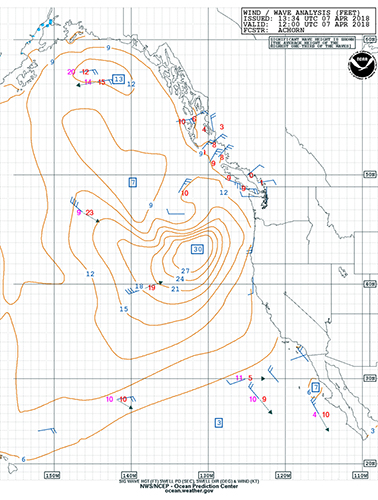
Also of interest for those offshore, the rapidly strengthening low led to quickly building seas. Figure 9 is the wind and wave analysis for the eastern Pacific at 1200 UTC on April 6, 2018, and an area of seas in excess of 12 feet is shown right along the track of the southern low. Higher seas are noted farther north in the Gulf of Alaska, associated with the large slow-moving low in that area. Figure 10 is the wind and wave analysis for 1200 UTC on April 7, 2018, and it is obvious that seas have grown significantly with maximum significant wave heights of 30 feet to the west of Oregon.
 |
|
Figure 10: Eastern Pacific wind/wave analysis chart valid at 1200 UTC 7 Apr 2018. |
In the title, I noted that this was a “little” Pineapple Express event. In a more significant Pineapple Express pattern, the 500-millibar flow would remain oriented in a west-southwest to east-northeast fashion for a longer period of time from north of Hawaii toward the western U.S., and several embedded 500-millibar troughs instead of just one would propagate through the pattern, leading to multiple areas of low pressure bringing several waves of heavy rain and also leading to difficult sea conditions in the eastern Pacific for a long period of time. The key is to look for the orientation of the 500-millibar flow pattern, a good deal of energy in the low pattern (i.e., fast wind speeds), trough axes embedded within the flow pattern (a bit more difficult now that the OPC does not directly indicate them on the charts) and a well-established moisture plume (the “atmospheric river”).