 |
|
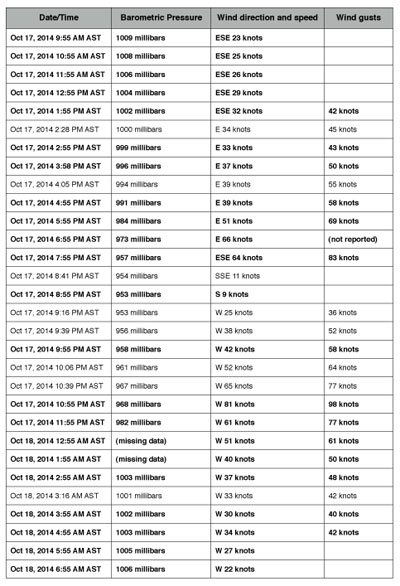
Figure 1: Table showing observations of barometric pressure, wind direction and speed, and wind gusts at L.F. Wade International Airport in Bermuda from mid-morning Oct. 17, 2014, through daybreak Oct. 18, 2014. Observations in bold type are regular hourly observations; others are special observations between the regular observations when conditions were changing rapidly. |
Hurricane season officially ended for the Atlantic and the eastern and central Pacific at the end of November. The season was a study in contrasts across these three regions, which are under the purview of the National Hurricane Center in Miami, Fla.
The eastern Pacific region went through a season with significantly more activity than normal. There were 20 tropical cyclones in this region during the 2014 season compared to a long-term average of 15. In addition, a greater percentage of these tropical cyclones reached hurricane status, and there were 8 major hurricanes (Category 3 or higher), which is more than double the usual number reaching that strength. There was also a greater impact in coastal areas than usual. It is not unusual to have an active season in the eastern Pacific but with little or no impact in the coastal regions of Central America and Mexico, since storms frequently form off the coast and then track west or northwest away from the continent. This season, though, there were several systems that either tracked close enough to the coast to have a significant impact, or actually made landfall. The most notable of these was Hurricane Odile, which made landfall near Cabo San Lucas as a major hurricane and then tracked north-northwest for a long distance up the Baja peninsula and reached the far northern Gulf of California as a tropical storm.
Three of the eastern Pacific systems tracked far enough west to enter the central Pacific region, and a couple of these produced significant impacts for Hawaii. Some of these situations were discussed in previous newsletters. This contributed to an above normal number of systems (five) in the central Pacific region for the season.
The western Pacific was quite active as well, including a super typhoon (Hagupit), which made landfall in the Philippines in early December. While this system did not produce the amount of destruction and massive loss of life that super typhoon Haiyain did just one year earlier, there was still significant damage and a few fatalities.
In the Atlantic, the situation was dramatically different than the Pacific, with a much quieter season than normal, certainly when compared to recent years. There were only nine tropical cyclones in the Atlantic this season compared to an average of 12. Six of those reached hurricane strength and two attained major hurricane strength, and these numbers are closer to long-term averages. Only one of the Atlantic systems made landfall in the U.S. — and only just barely, as hurricane Arthur passed over the outer banks of North Carolina during the Independence Day holiday period, then dissipated over the Bay of Fundy just west of Nova Scotia.
 |
|
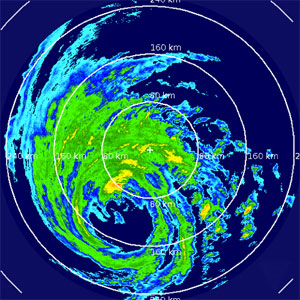
Figure 2: Weather radar from Bermuda shortly after 2 p.m. on Oct. 17 as Gonzalo was approaching the island. |
Despite the relatively quiet Atlantic season, there was one location that was rather unlucky, and that was Bermuda. The island outpost sustained direct hits from two systems within the same week in October. The first was Fay, which was a strong tropical storm when it passed the island, not reaching hurricane strength until about a half a day after it departed. The system produced wind damage and flooding on the island with many power outages.
Less than a week later, before cleanup from Fay could be completed, an even stronger system struck the island. Hurricane Gonzalo was a Category 2 system when it made a direct hit, having actually weakened from Category 4 status less than one day prior to reaching Bermuda. Damage was even more widespread across the island with this system. Miraculously, there were no fatalities from either system, likely due to excellent preparation in advance of both systems, and the fact that timely warnings were issued, and most importantly, heeded by the residents.
From a meteorologist’s point of view, a direct hit on a location that has good weather monitoring equipment, like Bermuda, offers a chance to get a close-up look at the system. Figure 1 shows part of the record of observations taken at the Bermuda Airport during the approach and passage of Gonzalo. Note the dramatic drop in barometric pressure through the afternoon and evening of Oct. 17 and the corresponding increase in wind speeds and gusts. The eye of the hurricane clearly passes very close to the observing station at close to 9 p.m., which corresponds to the lowest pressure reported. Note the dramatic drop-off of wind speeds in a very short period of time as the eye arrives. The lull in the winds is short lived, though, as the wind speeds and gusts increase rapidly right after the eye passes — but from the opposite direction as was the case during the approach of the eye. The strongest recorded winds at this observing point occurred behind the hurricane late in the evening; after midnight, winds gradually eased as the barometric pressure rose.
Figure 2 shows a radar image of the approaching hurricane at shortly after 2 p.m. AST on Oct. 17. The banded nature of the precipitation is evident, as is the void of precipitation in the eye. The eye appears fairly large on this image, which may be a result of the very heavy precipitation between the radar and the center of the system causing the radar to have trouble picking up somewhat lighter precipitation farther away and closer to the eye. The eye is likely not as large as it appears on this image. The image also shows the very nearly circular shape of the system.
 |
|
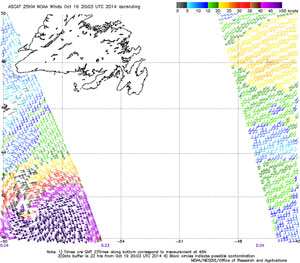
Figure 3: Wind information derived from the ASCAT satellite after 8 p.m. on Oct. 18 after Gonzalo moved north-northeast away from Bermuda. Grid shows latitude and longitude. Note that Bermuda’s location (approx. 32.5° N/64.5° W) is south and west of the area shown in this figure. |
Figure 3 shows data from an ASCAT satellite pass during the evening of Oct. 18 after Gonzalo moved north-northeast away from Bermuda. This particular satellite is able to determine wind speed and direction on a rather fine scale. The center of the hurricane is obvious, and wind speeds greater than hurricane force are shown to the east of the center. The circular shape of the circulation is evident, as is the compact nature of the wind field. Gonzalo would pass just southeast of Newfoundland on Oct. 19.
In speaking of the severity of a hurricane season, everything is relative. Even though the Atlantic hurricane season had less activity than normal, and many would classify it as a “quiet” season, the residents of Bermuda would likely strongly disagree. It is not a quiet season if a system impacts your particular area of interest. This points out the need to always be prepared for a possible tropical cyclone impact, even if the seasonal forecast is for a less active season in your particular ocean basin.