
Forecast verification is an important part of the forecast process for meteorologists. Verification involves checking to see how well — or how poorly — a forecast matched what actually occurred. Voyagers can perform their own version of verification (more on that below). The process of verification is important to the meteorologist because it can help identify areas and situations where forecast skill is less than desired. This, in turn, allows for the improvement of forecast tools and, ultimately, better forecast products.
Computer models are one of the most powerful tools that meteorologists have to help them generate forecasts, and the improvement in these models has led to a dramatic improveent in forecast skill through the last couple of decades. In fact, accuracy for a four- to five-day forecast today is similar to that of a two-day forecast a generation ago. This becomes quite apparent when watching weather presentations on television news shows. Forecasts seven days ahead are now routine for most broadcasts. While the longer-range portion of those forecasts still contains a fair amount of uncertainty in many situations, such forecasts would not have been possible for the previous generation.
 |
|
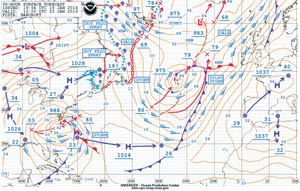
Figure 1: 96-hour forecast on Tuesday, Jan. 19, 2016. |
Trying it yourself
The verification process can be performed by voyagers on their own and can help to develop a confidence factor in the forecasts that sailors use to help in their decision-making process. This is something that will need to be done over a fairly long period of time, like an entire season. This will allow the voyager to determine how reliable the forecasts are, and when to allow a greater error factor, which might lead to using a higher margin of safety when making voyaging plans in certain situations.
As an example, we can examine the powerful snowstorm that impacted the eastern U.S. in January of 2016. On Saturday, Jan. 23, heavy snow was occurring over much of the mid-Atlantic region, including the major cities of Washington, Baltimore, Philadelphia and New York. There were also very strong winds occurring over much of the western Atlantic south of New England to the Bahamas, east to Bermuda and west to the eastern Gulf of Mexico, which were producing extremely rough seas.
 |
|
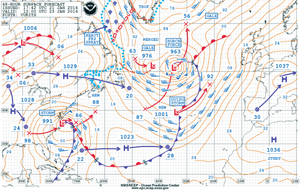
Figure 2 is the 48-hour surface forecast issued two days after Figure 1 and showing a similar situation. |
Looking first at the 96-hour surface forecast, which was generated on Tuesday, Jan. 19 and was valid at 1200 UTC on Saturday, Jan. 23 (Figure 1), we can see that a low pressure center with a central pressure of 988 millibars was forecast with its center forecast to be just northeast of Cape Hatteras. An occluded front was forecast to be extending southeast from the low to about 34° N/71° E, and from there, a cold front was forecast to extend SSW through the central Bahamas, and a warm front was to extend southeast to near 28° N/62° W. A storm warning was indicated on the chart for this system, meaning winds of 48 to 63 knots were expected over the portion of the Atlantic impacted by the system, and the wind barbs on the chart indicated a fairly large area of strong winds distributed through the circulation of the storm.
If we now jump ahead to the 48-hour surface forecast issued two days later but still valid at the same time (Figure 2), we find a very similar situation is forecast. The forecast central pressure is just a few millibars higher than the earlier forecast indicated, and the orientation of the fronts and the wind field is quite similar.
 |
|
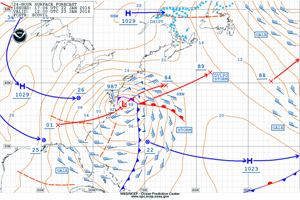
Figure 3 is the 24-hour forecast that shows a stronger system with a central pressure of 987 mb. |
Moving ahead another day, the 24-hour forecast issued on Friday, Jan. 22 (Figure 3), shows a slightly stronger system with a forecast central pressure of 987 millibars. The center of the low is forecast to be a bit farther northeast than the previous forecasts indicated, but the orientation of the fronts is similar and the wind field is impacting about the same area, although its northern edge is a bit farther north toward southern New England. Notice that the map background of the chart is different; this is due to the fact that 24-hour forecast products are regional charts, rather than full ocean charts.
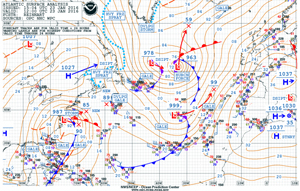
Finally, we examine the surface analysis chart for Saturday, Jan. 23, at 1200 UTC (Figure 4) to see what actually occurred. This chart shows that the low center was actually 987 millibars at that time, and that the position of the low center, the fronts and the wind field were very similar to the 24-hour forecast.
 |
|
Figure 4 is the surface analysis chart for Jan. 23 that shows what actually happened. The low pressure number agrees with the 24-hour forecast and the positions of the weather elements are very similar to the 24-hour forecast. |
Process reveals accurate forecast
Going through this process for this system tells us a few things. The forecast for this particular low was very accurate through the entire 96-hour time frame. The forecasts of the central pressure of the low were very close to the actual value (in fact, right on for the 24-hour forecast), and the forecast position of the low was slightly too far southwest for the longer-range forecasts but got closer with the shorter-term forecasts. The bottom line is that for anyone with interests on the waters of the western Atlantic, the forecasts all sent the correct message that conditions on the water were going to be very difficult, if not downright dangerous. Also, for those along the coast of New Jersey, significant advance warning was provided that very strong onshore winds were likely to impact the coast with large waves and, since the astronomical tide cycle was at its peak during this time frame, this advance warning was even more important.
In order to more fully assess how well the forecasts did, we can examine other areas of the ocean basin and make similar comparisons. For example, the hurricane-force low in the central Atlantic on the analysis chart was captured fairly well two days in advance with the 48-hour forecast but not as well four days ahead on the 96-hour forecast with the central pressure off by 12 millibars and a position almost 200 miles too far south. Also, on this forecast a storm warning was indicated, implying less severity than the actual hurricane-force conditions that occurred. The 96-hour forecast also did not indicate the secondary gale-force low farther south in the central Atlantic. The 48-hour forecast did show this low but indicated storm warning conditions, overestimating the gale conditions that actually occurred.
In fact, any particular area of interest can be examined in the same manner to assess how well or how poorly the forecasts of surface pressure and wind speed and direction were. In addition, we have examined only surface forecast charts here, but the same procedure can be used to assess forecasts of sea state, or 500-millibar forecasts. In general, the shorter-range forecast will tend to be more accurate than longer-range forecasts, as seen in the central Atlantic on this set of charts. This means that examining trends on the forecast charts as the date and time of interest approach has merit.
 |
|
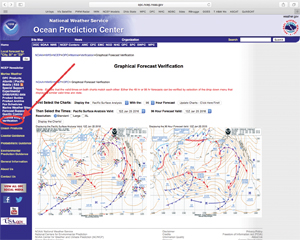
Figure 5, a page from the Ocean Prediction Center website showing the verification section that allows mariners to view charts from different forecast cycles side by side. |
To be of more value, the verification procedure needs to take place on a fairly regular basis. On the Ocean Prediction Center website (www.opc.ncep.noaa.gov), the process has been made easier for mariners by providing a convenient interface that allows two charts from different forecast cycles to be viewed side by side (Figure 5). To get to this interface, simply click the “Verification” link in the menu on the left side of any page at the site (shown by the arrow and circle in Figure 5). The drop-down menus on the verification page allow selection of the charts and times of interest, and it is fairly simple to do several comparisons in a very short period of time. While all forecasts are not perfect, the verification procedure will show that most of the time the forecasts produced are very reliable and can be used with confidence.
Contributing editor Ken McKinley owns Locus Weather in Camden, Maine, and provides weather routing services. He also writes the Ocean Navigator weather email newsletter.