For many folks in the eastern and southern U.S. as well as eastern Canada it has been one of the more rugged winters in recent memory. There were many storms that produced significant amounts of winter precipitation (snow, sleet, freezing rain) along with strong winds, and the temperatures were well below normal in many locations. And a storm in late March provided a case study on the dangers of rapidly developing storms, sometimes known as “bombs.”
Of course, the mainstream media was all over the unrelenting cold temperatures, complete with foreboding music for every winter event, live reporting from the scene of the worst conditions in the latest winter storm, and scary graphics centered around the term “polar vortex.” The media coverage would make one believe that these areas had never experienced winter weather of this magnitude before. Of course they all have on many occasions in previous years. And the polar vortex is not a new term at all, just one that the media discovered this year and it met their need to sensationalize the weather. There is no doubt that winter weather was quite a bit more significant in many areas than in recent years, but the weather conditions were not unprecedented.
 |
|
Figure 2 |
 |
|
Figure 3 |
Let’s look at the term “polar vortex.” From the Glossary of Meteorology, published by the American Meteorological Society, it is defined as “the large scale cyclonic circulation in the middle and upper troposphere centered generally in the polar regions.” It’s there every winter. It does meander about the pole. Its exact location varies every year along with the distance that it wanders away from the pole. This year, the polar vortex moved a bit farther away from the pole than usual for a greater amount of time. That deviation happened to bring the polar vortex into southern portions of eastern Canada for long periods of time. In some years, the vortex will spend more time over northern Europe or Siberia, or will be farther west over Canada. In those years, the winter weather pattern for the eastern U.S. and Canada will be very different than this past winter. The position of the polar vortex this year provided an ample supply of cold air to the eastern U.S., and also supplied the dynamic energy at upper levels to help generate many strong storms.
The position of the polar vortex also had an impact on the North Atlantic Ocean. With many strengthening storms moving through the eastern U.S. and into the Atlantic, and plenty of upper level energy on the eastern and southeastern flanks of the polar vortex, rapidly strengthening lows over the Atlantic were more frequent than usual. In fact, in the month of December 2013 alone there were 14 separate hurricane-force lows, and 10 of these systems were classified as “rapidly developing” meaning that their central pressure dropped at least 24 millibars within a 24-hour period. Here is a link to a loop of surface pressure charts from NOAA’s Ocean Prediction Center covering these events: www.opc.ncep.noaa.gov/Loops/Atlantic_December_2013/Charts2.php
 |
|
Figure 4 |
 |
|
Figure 5 |
 |
|
Figure 6 |
The active weather over the North Atlantic continued through the rest of the winter, and in late March another very strong system tracked northeast off the East Coast of the U.S. and eventually through Atlantic Canada. As luck would have it, the center of this system passed very close to a buoy maintained by the Canadian government. The storm was at about its peak strength during the buoy pass and examining the data gathered by this buoy allows us to see how fast conditions can change when one of these “rapidly developing” lows impacts an area.
Figures 1, 2, and 3 are the surface charts of the western Atlantic at 0000 GMT March 26, 2014, 1800 GMT March 26, and 0000 GMT March 27. The first chart shows the low prior to its rapid intensification well southeast of Cape Hatteras; on the second chart the low is very close to the position of the buoy; and on the third chart the low has passed the buoy and is approaching eastern Nova Scotia. Note that between the first and second chart, the central pressure of the low has dropped from 994 millibars to 955 millibars, a drop of 39 millibars in less than 24 hours, which clearly qualifies the low as rapidly developing, also known as a “bomb.”
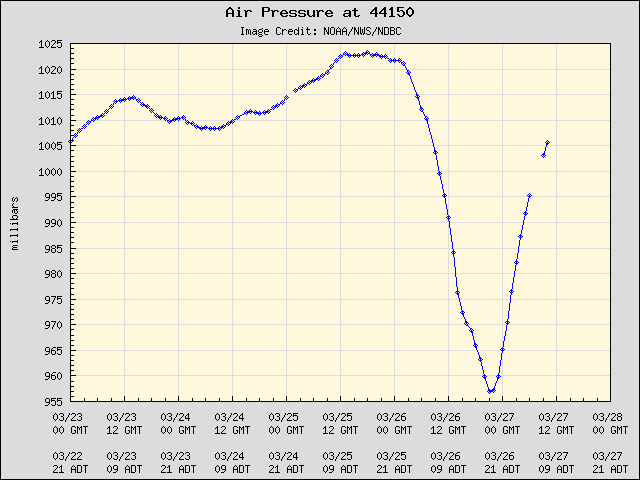
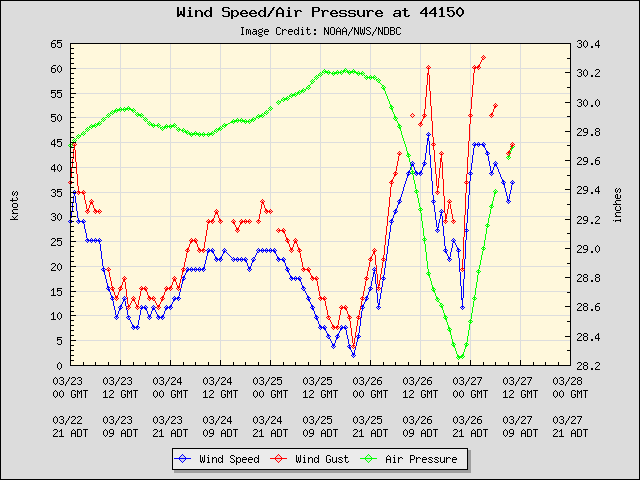
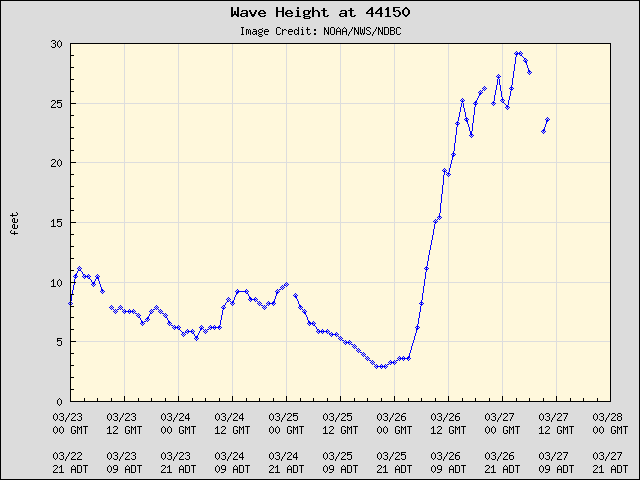
Figures 4, 5 and 6 show data from the buoy at Le Have Bank, south of western Nova Scotia near 42° 30’ N, 64° 00’ W. Figure 4 shows the pressure in millibars. Note the precipitous drop in pressure starting around 00 GMT on March 26 when the pressure was 1022 mb and ending at about 21 GMT with the pressure at about 956 mb. That’s a drop of 66 millibars in less than 24 hours! Figure 5 shows the sustained wind speeds and accompanying gusts in knots with the pressure trace overlaid as well. Two peaks are seen, one as the low approached the buoy, and one behind it as it departed. A period of lighter winds prevailed closer to the center of the low as it passed the buoy. Figure 6 shows significant wave height in feet. Keep in mind that significant wave height is an average, and the extreme wave height could be as much as twice the significant wave height, which in this case could have approached 60 feet.
It’s rather unlikely that any recreational ocean voyagers were operating in this area at this time of the year, but rapidly developing lows, while more common in the winter, can occur at any time of year. That’s the main message here. Conditions in the vicinity of the track of these lows are likely to change dramatically in a very short period of time. Examining the data in this case clearly shows this with rather benign conditions deteriorating to a very perilous situation in less than 24 hours. Therefore, when the words “rapidly developing” appear on a chart, no matter what time of year, they should be taken seriously.