Almost everyone is familiar with what happens when one tosses a small rock into a calm pond. The rock displaces the water level where it impacts the pond, and as the water level rebounds toward the equilibrium level, waves are generated which propagate away from the point of impact in concentric circles. This is a manifestation of the energy that the rock imparted to the surface of the water.
A similar phenomena applies when tossing a small rock into the ocean, but the difference is that most of the time, the ocean is not calm, and waves already exist. In almost all cases, the waves generated by the impact of the small rock are dwarfed by the pre-existing waves, so one generally is not able to discern the very nice concentric circles propagating away from the point of impact like in the case of the quiet pond.
There are many factors that generate waves in the ocean, including some that are similar to the “rock in the pond.” These include icebergs dropping into the ocean from glaciers, mudslides or landslides, and even tsunamis, which occur due to seismic events that can displace large amounts of water in a limited area. But most waves that we observe in the ocean are generated by wind force on the surface of the water.
The process of wave generation by the wind is a bit different than the “rock in the pond” situation. Wind imparts a horizontal force to the surface of the water that displaces the water level, and this force then generates waves that propagate in the direction of the air movement that generated them. Waves will grow larger when the wind is blowing in the same direction over a larger portion of the ocean (the fetch); when the wind is stronger (the force); and when these winds last for a longer period of time (the duration). The ability to quantify these three factors — force, fetch, and duration — allows the computation of how large the waves will become. Once waves have been generated, they will typically move faster than the wind, and they will leave the fetches where they were generated and continue to proceed through the ocean until they run into shallow water or land.
It all sounds simple, but in the real world the fetch areas are not necessarily that well defined, nor are they stationary. There are also many fetch areas in different parts of the ocean, and some fetch areas can persist for several days while others may last only a few hours deepening on how weather patterns evolve. This all means that there can be waves of differing heights and periods and coming from different directions all impacting the same area at any given time. Fortunately forecasts for waves have become widely available in several different formats, and the wave forecast models have become quite sophisticated allowing forecasters to fairly accurate in their predictions of oceanic wave fields. This means that mariners are able to obtain good information about the sea states they can expect several days in advance.
The winds around tropical cyclones (tropical depressions, tropical storms, and hurricanes) generate waves just as the winds produced by other weather systems do. Tropical cyclones are generally smaller systems than oceanic highs and non-tropical lows like winter nor’easters. This means that the fetch areas associated with tropical systems are not very large. Also, the strongest winds with tropical cyclones are typically concentrated near the center of the system, and with the rotary motion of the systems the wind direction changes fairly rapidly within the area of strong winds, which also acts to limit the fetch.
In the case of very strong hurricanes, though, the winds are so strong that even with the limited fetch, they will generate very large waves near their centers. In addition, the very low pressure near the center of the system will allow water levels to be displaced upward which will also produce waves. The large waves generated near the center of a strong hurricane will tend to propagate outward from the center of the system. Often a strong hurricane is the only strong system within an ocean basin, and after a few days, the wave pattern looks very much like the rock in the pond that I opened with, though on a much larger scale.
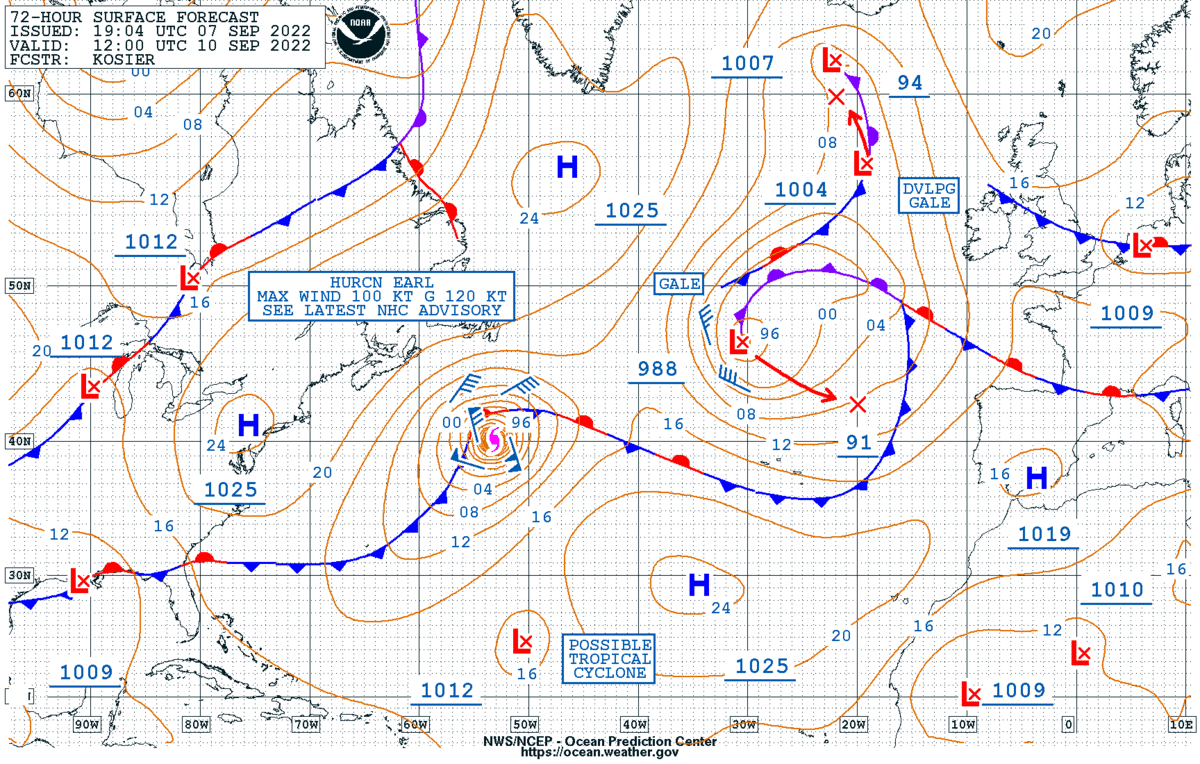
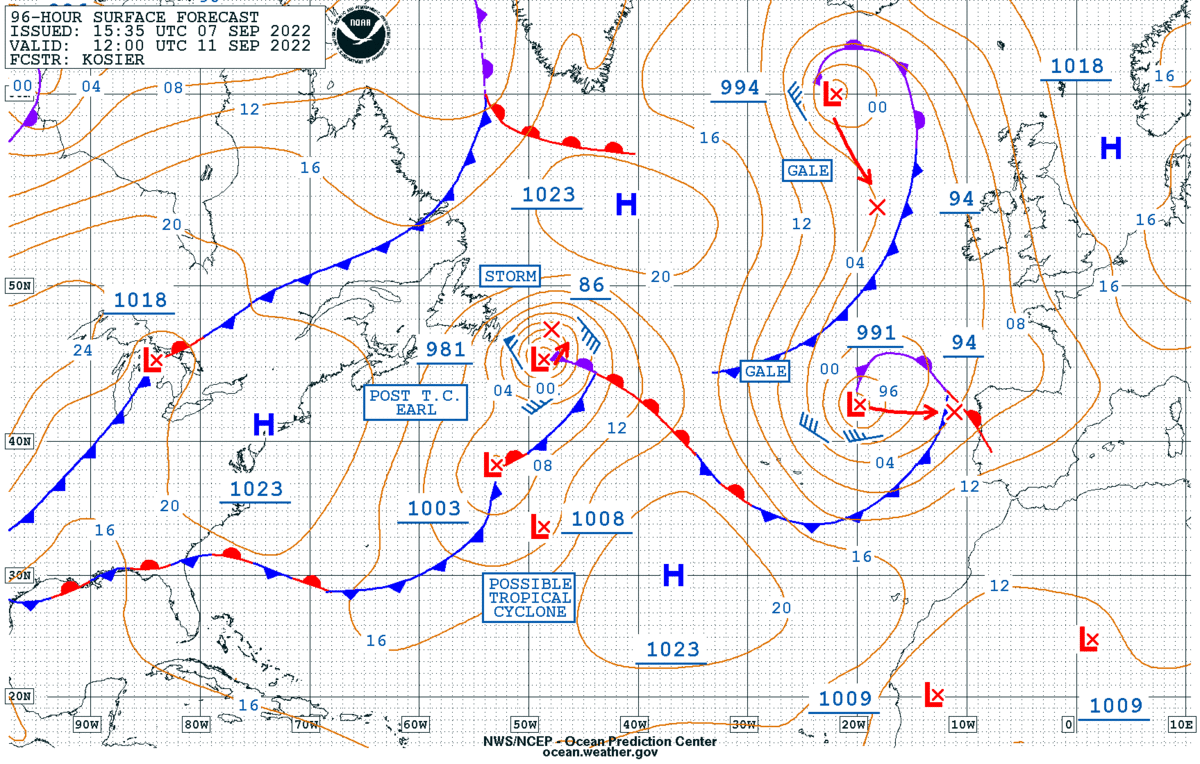
In early September of 2022 there were two tropical systems present in the Atlantic Basin at the same time, and we can examine some weather charts to see how the sea state was impacted by these systems. Figure 1 is a 72-hour surface forecast valid at 1200 UTC 10 Sep 2022. This chart shows Hurricane Earl in the western Atlantic, and also a strong low at 47° N/30° W in the eastern Atlantic which had been Hurricane Danielle a few days earlier. Figure 2 is a 96-hour forecast valid one day later, by which time Earl is forecast to be a post-tropical cyclone, still with a very strong and compact situation.
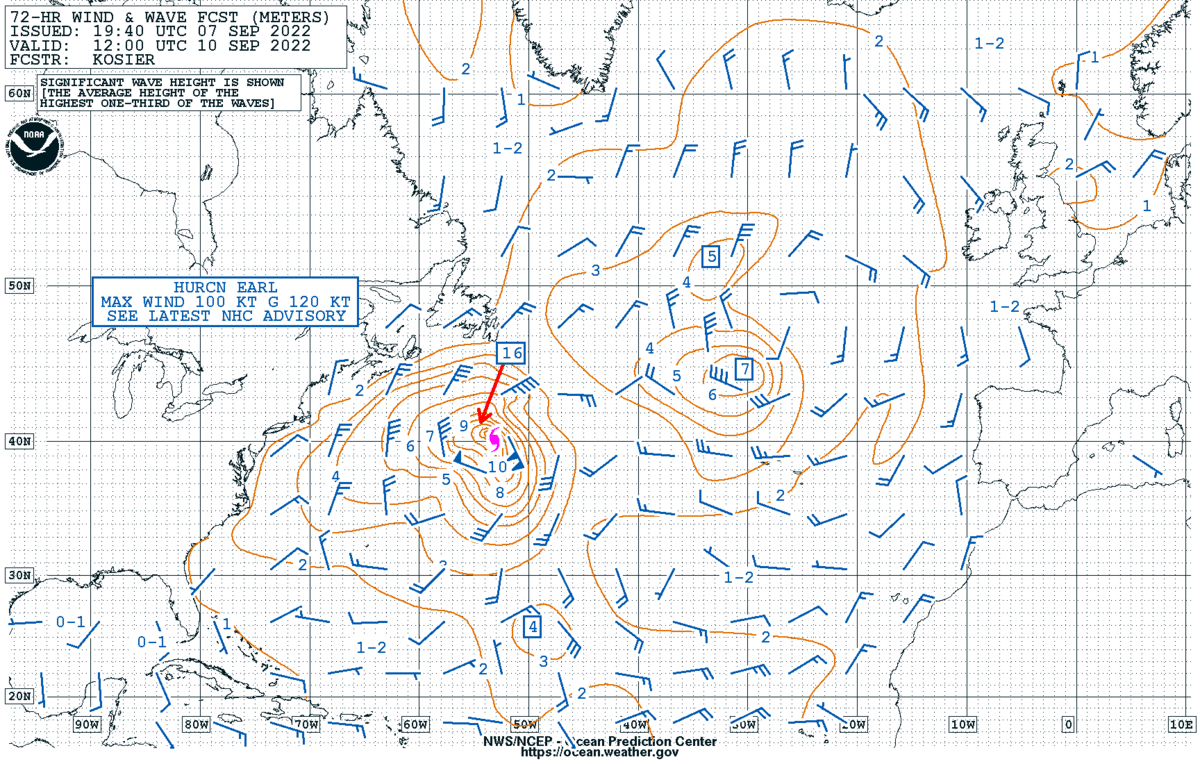
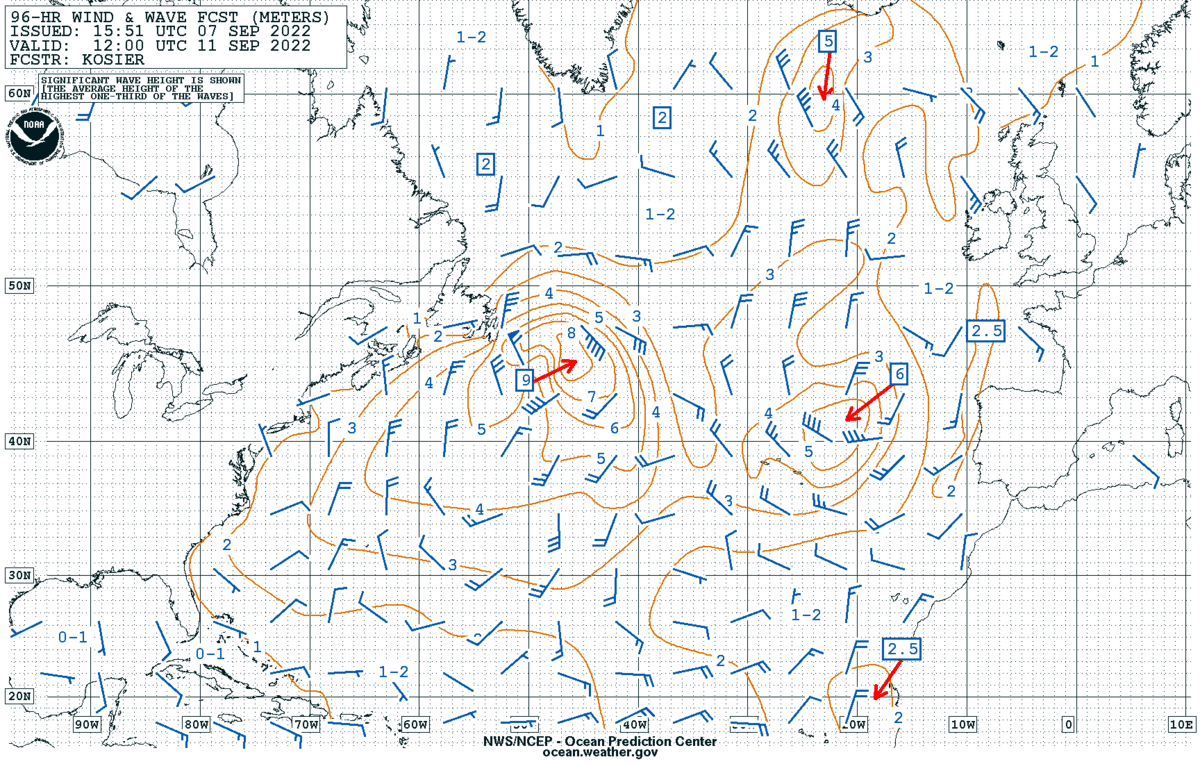
Figure 3 is the wind wave forecast valid at the same time as Figure 1, and it shows that the maximum significant wave height associated with Earl is forecast to be 16 meters over a limited area near the center. To the east, maximum significant wave heights are forecast to be seven meters associated with the low that was Danielle. Figure 4 is the wind wave forecast valid at the same time as Figure 2. There are still well defined areas of high waves associated with the two systems, though the maximum significant wave heights with Earl are forecast to be lower than 24 hours earlier. In all cases, significant wave heights drop off farther away from the center of the system.
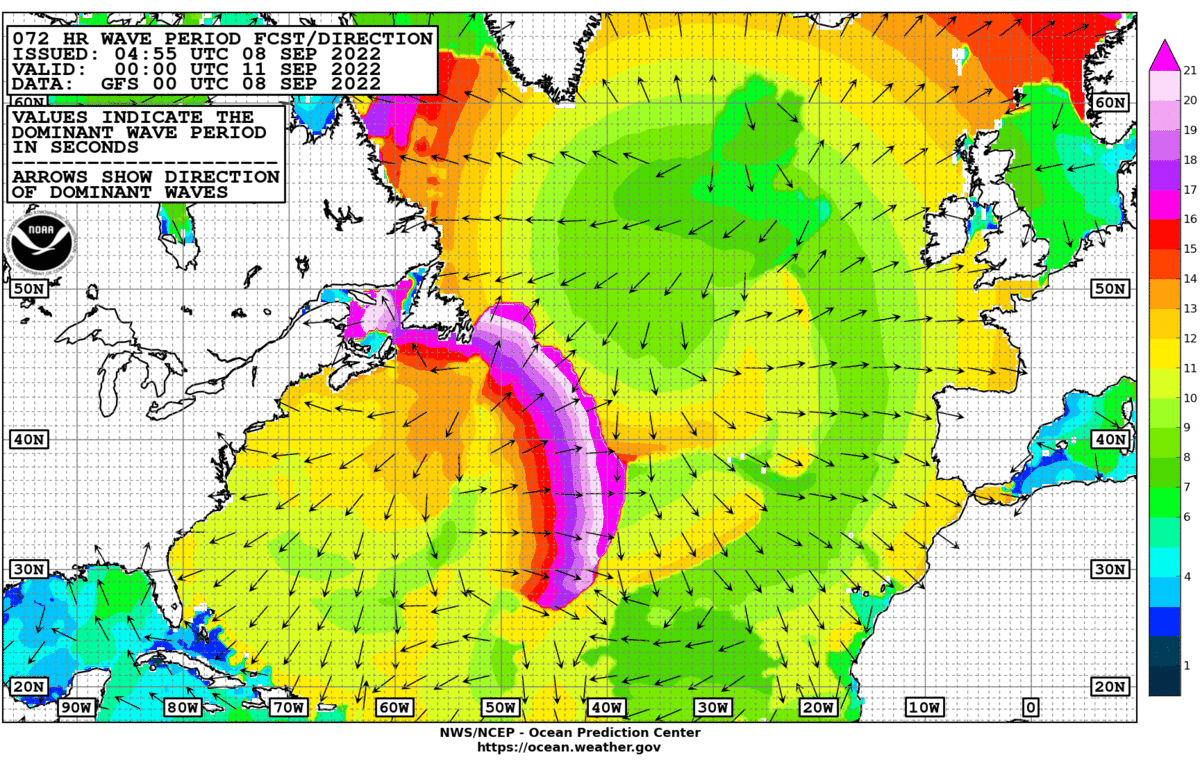
The “rock in the pond” phenomena becomes very evident when examining the wave period and direction forecast charts. Figure 5 is valid at the same time as Figure 3. Looking first in the eastern Atlantic, the wave direction arrows show a large pattern of waves propagating away from the vicinity of Danielle. The wave periods get longer as they move away from the center of generation, and the pattern extends west to eastern Newfoundland and Labrador, north to to Iceland, and east to the British Isles, western Europe and northwestern Africa. At the same time, the wave pattern from Earl is quite prominent, extending west to the east coast of the U.S., north to southern Newfoundland, and east into the central Atlantic. There is a zone where the two wave fields meet in the central Atlantic, made obvious where the arrows are pointing right at each other. This region is known as a wave front and it can be an area where confused seas will prevail. Referring back to Figure 3, it can be noted that the forecast significant wave heights in this region are lower than most other areas. Even so, the sea state could be difficult in this region due to the presence of the wave front.
Finally, Figure 6 (below) shows that the wave field from Earl has expanded greatly through most of the ocean basin and overwhelmed most other waves. This is a good illustration of how far from the center of a tropical cyclone the swells will propagate within a 24-hour period, and how large an area can be impacted. There is a wave front present on this chart as well, shown very clearly by the change in color from purple to green between 20° W and 30° W. South of 45° W, the wave direction is the same on either side of this front, but it is still termed a wave front because of the rapid change in wave period which indicates that one swell set is overtaking another, and confused seas can still result.

So, in terms of sea state, strong hurricanes act very much like dropping a big rock in big pond!
Contributing editor Ken McKinley is a weather router for both commercial and recreational clients via his companyLocus Weather in Camden, Maine