As we finish up 2018, I thought I would use this newsletter to talk briefly about a couple of topics rather than go into more detail about one topic.
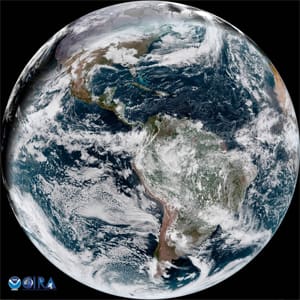
First, satellite imagery. In the 2018 edition of Ocean Voyager, I wrote an article about the newest GOES weather satellite, which had recently become operational and is now providing much improved satellite imagery for the Atlantic, central and eastern North America, South America and the eastern South Pacific. This satellite is not the newest any more, as GOES-17 — with basically the same hardware and instrumentation — is now in orbit and undergoing testing and will serve as the new GOES-West satellite when it is declared operational early in 2019. Thus all of the improvements that were cited in the article will now be available for all but the far western Pacific, as well as for western and central North America. To show the relative coverage areas of the two new satellites, refer to Figure 1 for a “full disk” image from GOES-East, and to Figure 2 for a “full disk” image from GOES-17, which will become GOES-West.
 |
|
Figure 2: Full disk image from GOES-17, which will be known as GOES-West once it becomes operational. |
Imagery from the new satellite can be viewed from its “pre-operational” website here. In addition to the typical views of weather systems, there are images of the western U.S. wildfires, and some high-resolution close-ups of Hawaii and other areas and phenomena of interest. Once this satellite becomes operational, the same benefits that were realized for its immediate predecessor will be available and will help forecasters provide better products for the Pacific and western North America.
Second, El Nino. It was anticipated that an El Nino would develop in the equatorial Pacific during 2018. While signs of the sea surface temperatures warming in that area have shown up, they have been slower to evolve than was anticipated, and the atmospheric response has not really kicked in yet. The anticipated development of El Nino factored into the Atlantic hurricane season predictions, and in particular the outlook that was issued in August was for a less active season than actually occurred because of the delayed arrival. Recall that the presence of El Nino typically means a less active Atlantic hurricane season. If El Nino develops as expected and lasts well into next year, the Atlantic hurricane season could be less active for 2019. Stay tuned! For more information on all things El Nino, visit www.climate.gov/enso.
 |
|
Figure 3: Wind/wave analysis chart 1200 UTC 17 December 2018. |
And finally, to close out this short newsletter, some rather impressive video of extremely large waves impacting the central California coast showed up on national news shows recently, and it is worth looking at the charts surrounding the event. The waves peaked on Dec. 17, 2018, with the eastern Pacific wind/wave analysis chart (Figure 3) showing significant wave heights of around 20 feet from the central California coast north to the Oregon coast. Looking at the 24-hour forecast of wave period and direction valid at 1200 UTC on Dec. 17 (Figure 4) gives a good indication of how the waves were propagating across the Pacific, with the red colors approaching the western U.S. indicating very long period swells that contain a good deal of energy. When these swells encounter shallower water they become steeper, and the result is the spectacular video that went viral. There is another region of long period swells farther west in the central Pacific.
 |
|
Figure 4: 24-hour wave period and direction forecast chart valid 1200 UTC 17 December 2018. |
Swells like these are generated by a large area of strong winds in about the same direction that then propagate away from their generation area. Thus it is worth looking at a surface chart prior to when the waves peaked. Figure 5 is a surface analysis chart valid the day before the charts above, and there are two large low-pressure systems on the chart that correspond to the two areas of large swells on the wave period chart. Notice the large number of isobars from south of 40° N northward to 50° N in association with the strong low in the Gulf of Alaska. It is this isobaric pattern that produced the winds generating the swells that impacted the California coast. The strong low in the central Pacific was responsible for the second area of large swells that were indicated on the wave period forecast chart.
 |
|
Figure 5: Surface analysis chart valid 1200 UTC 16 December 2018. |
 |
|
Figure 6: 500-millibar chart valid 1200 UTC 16 December 2018. |
And one final chart to examine, the 500-millibar analysis valid at the same time as the surface chart (Figure 6). The flow pattern on this chart is generally zonal, or west to east, which promotes rapid motion of storms generally from west to west. There is a good deal of energy present — indicated by wind speeds in excess of 100 knots — and this helps to support strong surface low-pressure systems. Thus it is not surprising in a pattern like this that there would be large seas generating over significant portions of the Pacific.
Best wishes to all for a happy and fulfilling 2019!

