When it comes to coastal charts, the thing voyagers are most interested in knowing is the location of the thin water. Running aground can vary from a nuisance to a disaster. The key to good charts is getting good bathymetric data. Now NOAA is working with some partners in government and industry to develop a new and highly efficient method for gathering depth information, especially in waterways that have shoal areas that frequently shift position, which are the most challenging areas to survey.
The traditional method for gauging depth was, of course, throwing the lead. A lead weight attached to a line marked with depths was tossed overboard. An effective system that worked for hundreds of years, throwing the lead is obviously labor intensive, slow and requires that you actually put a vessel directly over the area that you want to measure.
The next big step was sonar-based depth measurement. A pulse of sound leaves a transducer, travels through the water column, hits the bottom, bounces off and returns to the transducer. If you know the time the pulse was sent and the time it took for the echo to return, you can determine the distance and thus the depth. Since this is an electronic system, you can automate the process and record depths continuously. As good as this system is, it still requires that you put some sort of vessel (even if it is a robotic, autonomous one) in the area for which you want depth information.
What if there was a system that allowed you to gather bathymetric info from a remote location so that you wouldn’t need to go the places you wanted to measure? This would be an especially useful tool for zones with shoal areas that change position frequently. That’s the idea behind a prototype system being developed by NOAA, the Korean Hydrographic and Oceanographic Agency, Oregon State University and private company Areté Associates. Instead of sonar, this system uses radar. But since radio waves can’t penetrate seawater more than a few inches, how can radar be used to gauge depth?
 |
|
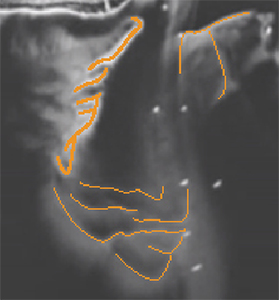
This radar image has shoals lined in red for clarity. |
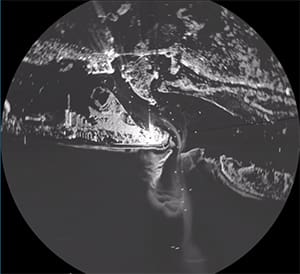
The radar bathymetric technique is called X-band radar wave imaging. Radar wave imaging uses backscattered radar returns to create images of surface waves. (A classic type of radar backscatter that every radar user is familiar with is sea clutter.) These surface waves reveal a great deal about the physical characteristics of the bottom. As NOAA explains it in a blog post: “The shape and depth of the seafloor — whether rocky or sandy, shoal or deep — influences surface currents as well as the character and speed of the waves and swell. Radar backscatter processing over time yields a series of coherent images of the wave field. By simply averaging the images of waves over a period, it is possible to depict the general shape of the seafloor bathymetry. Additional processing of the coherent wave-speed images produces derived depths.”
NOAA tested this technique in two locations. One was on the Oregon coast using an X-band radar that Oregon State University installed atop a tower at the Coast Guard station at Yaquina Bay. The other location was at the Coast Guard station Fort Macon, near Beaufort Inlet, N.C., where the radar was set up on a temporary tower.
Radar images from both of the tests have been compiled by NOAA and can be viewed on the NOAA Coast Survey website.
Should the tests prove successful, it may mean that electronic charts can be rapidly updated for shifting shoal areas without the need for hazardous and expensive survey operations.
Also, the added benefit of having updated digital data for these areas could lead to other uses as well. The Areté company created a real-time cloud service to explore the potential for wide-use and commercialization of this radar data. The cloud service was set up to automatically process regular uploads of nonproprietary radar data to produce raw and time-averaged radar images and movies, bathymetry and uncertainty grids and water levels. The cloud service also makes commercialization of the data easier for third-party developers.
This use of radar technology to determine wave action on the surface is also employed by satellites to determine surface wind speed and direction worldwide. In fact, a radar scatterometer was used very successfully by NASA’s QuikSCAT satellite from 1999 to 2009. In 2009 the scatterometer instrument suffered an equipment failure that reduced its capability. A replacement scatterometer was placed aboard the International Space Station in 2014, but it failed in 2016. Europe’s EUMETSAT operates scatterometer-equipped weather satellites.

