Using every resource available to get a comprehensive weather picture
When it comes to weather information, ocean voyagers can never have too much help, and with today’s connected world there are many ways to gather as much data as you want or need. However, some of the tried-and-true sources that have been in use for decades or longer still form the basis of every voyager’s toolkit.
Long ago a friend who voyaged regularly across the Atlantic and back on tiny, simple homemade boats gave me a piece of weather advice I have never forgotten and that still remains true today. When I asked him what he used to get weather while at sea he said he used nothing! Instead, he noted that even the best forecasts tended to be only good for four to five days out, and then after that you would be at least 400 to 500 miles offshore and what could you really do about the weather at that point other than deal with it? If you are voyaging in the best season, following the established safe routes, chances are low you will encounter anything really nasty, and even if a gale is coming there is often not much you can do to get out of the way.
Open the window
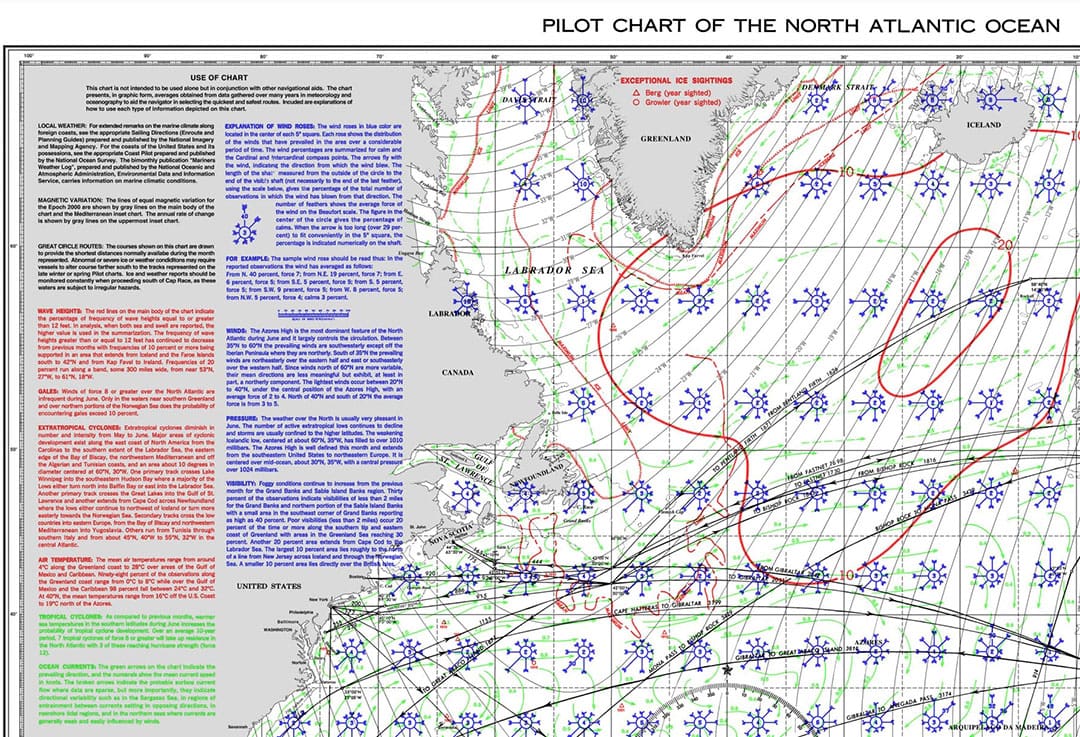
This means getting your “weather window” right in the first place is probably the single most important forecast you will obtain on any offshore passage. And, luckily that is when you will be the most connected to available weather resources. To start this process of finding the best season and time to go I still find the pilot charts to be invaluable. In the past many of us purchased and carried actual printed copies of the pilot charts, but they are now all available online at msi.nga.mil/Publications/APC. Just choose the atlas you want to see and the particular page, and you have the option to print them if you can figure out how to do it (they are big)! Frankly, I find the online version somewhat easier to handle and read than the old paper versions since you can easily zoom right in on the area of interest. Take a screenshot of the relevant areas you need to refer to.
Pilot charts are loaded with information on historical average wind directions and speeds, ocean currents, ice limits, visibility, tropical storms, etc. Of course, they are based on the average of many voyages and observations, so what you see is not guaranteed. However, pilot charts remain a critical tool in planning any voyage. The same website includes digital versions of all sorts of other useful publications like sight reduction tables, light lists, and sailing directions. Though not specific to pleasure craft, sailing directions provide in textual form tons of great information on general trends in weather, currents, and local climates that every voyager needs to know.
Crawl the Web
Assuming you’ve planned your trip for the right time of the year, the first place to head when starting from the east or west coasts of the United States is the National Weather Service Marine Weather Forecast page (www.weather.gov/marine/). If you click on the map you can choose the geographic region of your starting point and then see a selection of text coastal zone forecasts out to about 45 nautical miles. There are also text forecasts for areas further offshore.
Another neat tool is the National Digital Forecast Database Display at (digital.weather.gov/). You can choose from many layers, and I find it useful to get an overall view of the offshore wind pattern within a few hundred miles of the US shore. Choose the “Oceanic” layer to see further out.
There are many, many different weather options on the NOAA/National Weather Service (NWS) website, but unfortunately, they are rather chaotically organized and continue to be changed, updated, and reorganized all the time. It is well worth spending some time perusing what is available to determine what is useful to you. Bookmark the relevant pages. I find the simple text coastal waters forecasts the best option for the first 50 miles or so of any offshore voyage. I have several local text forecast pages bookmarked so I can easily refer to them on my home computer or on my smartphone.
All ears
NWS text forecasts are the same ones you will hear if you tune in to the weather channels on your VHF radio, which is often the most convenient way to keep up on them while coastal sailing. In addition, the VHF broadcasts will provide marine observations of windspeed, direction, gusts, and local weather hazards, like thunderstorms. When monitoring VHF channel 16 while underway the Coast Guard will break in with special marine warnings as needed, which is very handy when thunderstorms are around.
In addition to VHF weather radio broadcasts, the U.S. Coast Guard provides high-frequency (HF) offshore voice broadcasts from six high seas communication stations. The list of frequencies and times is here: www.weather.gov/marine/uscg_broadcasts. The list of weather forecast products that are broadcast is here: www.weather.gov/marine/hfvprod. These reports are important for most voyagers because they can easily be received by boats equipped with offshore single-sideband (SSB) HF radios, or even portable radio receivers. I have successfully picked up the offshore forecasts using an inexpensive battery-powered receiver.
You’ve got mail
However, many voyagers will also have the means to send and receive emails or even access the Internet when offshore. If you can receive email, the National Weather Service offers a free FTPMAIL service (tgftp.nws.noaa.gov/fax/ftpmail.txt) that will email your requested forecasts to you. However, using this system is a bit arcane (read all the directions carefully!), and several commercial services streamline the process of receiving emailed forecasts for a fee. I have found the free Saildocs system works well too (www.saildocs.com/info). Saildocs is provided by the SailMail Association, which is a nonprofit organization that can email documents via Iridium, Inmarsat, VSAT, Globalstar, Thuraya, wi-fi, cellular networks, or via SailMail’s own worldwide network of SSB-Pactor radio stations.
In addition to accessing free NOAA/National Weather Service data, using SailMail you can access the paid PredictWind (www.predictwind.com) offshore forecasts and get GRIB weather files for creating your own onboard weather maps. Receiving GRIB files over low-speed, data-limited connections, like a portable satellite phone or a SSB radio, is preferable to burning up your data and time trying to access things on the regular web. However, it takes time and experience to learn to properly interpret GRIB created weather charts, and I have found that the general trends described in the text or voice forecasts from the National Weather Service are plenty accurate for offshore use. Many times I have listened over the radio to people arguing about fine details of a GRIB plot that indicates to me the skippers are over-zooming in when the data doesn’t support that level of definition.
Another great way to access PredictWind offshore forecasts is using the Iridium GO! satellite communication system with monthly paid plans required. In addition, there are PredictWind apps for Android, iOS, Windows, Macs, and Chromebooks. Obviously, Internet service is required for these to work, though the apps are designed to work with poor quality cell signals and Internet connections.
Be appy
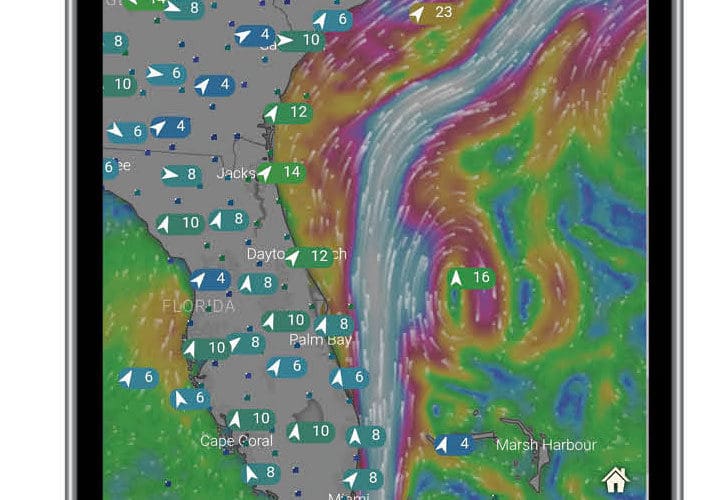
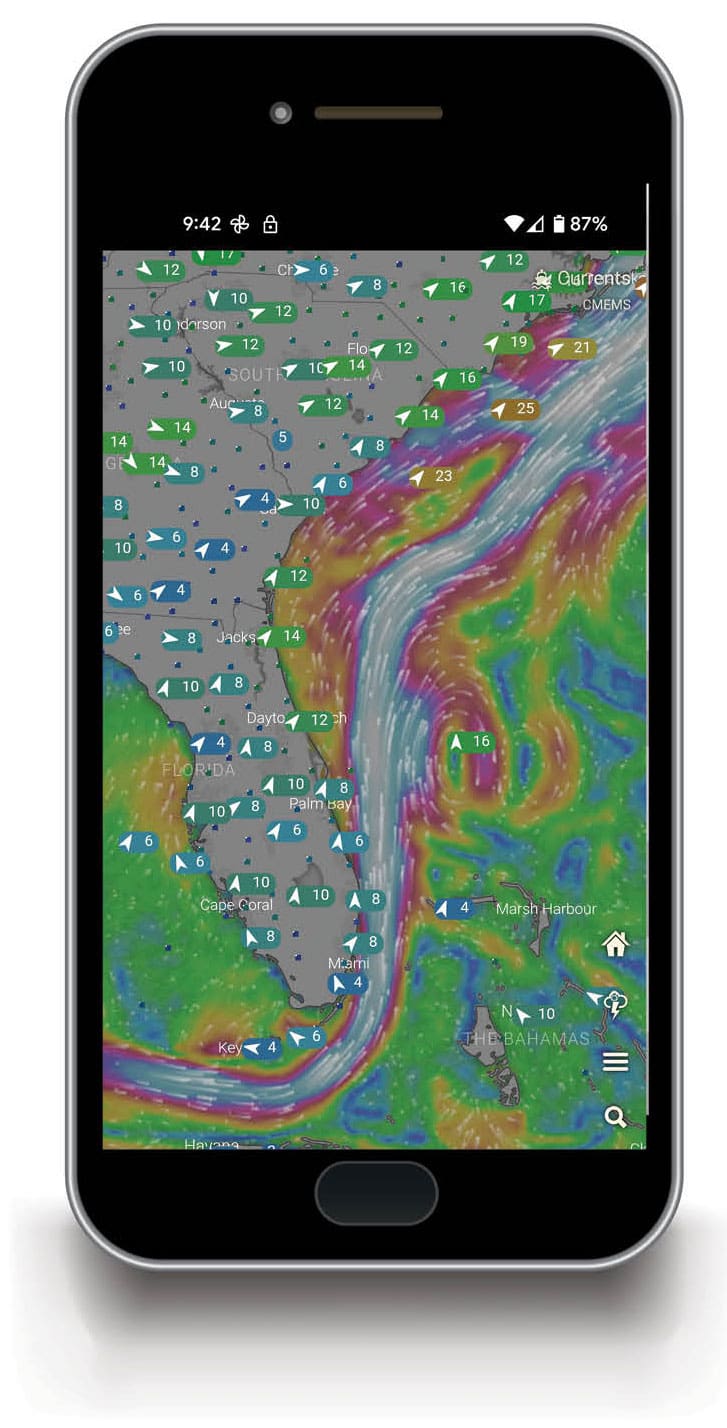
There are many great phone apps that can keep you informed when you are within range of an Internet connection. There are too many to review them all, but I have found Windy particularly useful for boaters. Even the free version of the app shows wind directions and strengths well offshore, and you can take a look at currents, hurricanes, and all sorts of other useful stuff. You can also take a look on the web at www.windy.com. I find the offshore current information particularly useful. For example, it will indicate the location of the Gulf Stream and its eddies, which is critical when voyaging to Bermuda. Note there are two different overlays you can choose: currents and tidal currents. The former includes the effect of wind on the surface currents, while the latter is just showing the tidal currents. In some places that will be critical, particularly in coastal passages.
Windy provides up to 10 days of wind and weather predictions in a beautiful and easy to understand format that I have found to be very accurate. It is great to be able to view the wind map and simply scroll ahead a few hours or days and watch how the winds will be shifting — also very educational as to how the weather works in a particular area. You can even choose to view different forecast models, such as the European or North American versions. Premium subscriptions offer more options and even more granular forecasts.
I find the “reported wind” option on Windy somewhat useful as it provides some actual observations from major buoys, light towers, airports and such. But, the SailFlow app (www.sailflow.com) includes many more local weather stations, which you can view in the free version, and of course there are more in the premium versions. Live, on-site wind readouts are very useful to calibrate the forecast to what is actually happening on the water. The forecasts cover large areas and can’t provide detailed predictions for your particular location, which might be somewhat sheltered or possibly is just seeing a different wind than was predicted. Many times these apps have helped me prepare for a blow that was a bit stronger than the forecast was showing, and other times I have ventured out knowing that the situation on the water was better than had been anticipated.
In some areas there are buoys or light structures well offshore, and these can be important when heading out or coming in from offshore. Here in New England there are several useful offshore ones: Nantucket Shoals, George’s Bank, and several southeast of Nova Scotia. Another useful webpage is the National Data Buoy Center (www.ndbc.noaa.gov) with an interactive, clickable map showing all the offshore buoys and their data. I have several of these locations bookmarked for my local waters and I check them regularly.
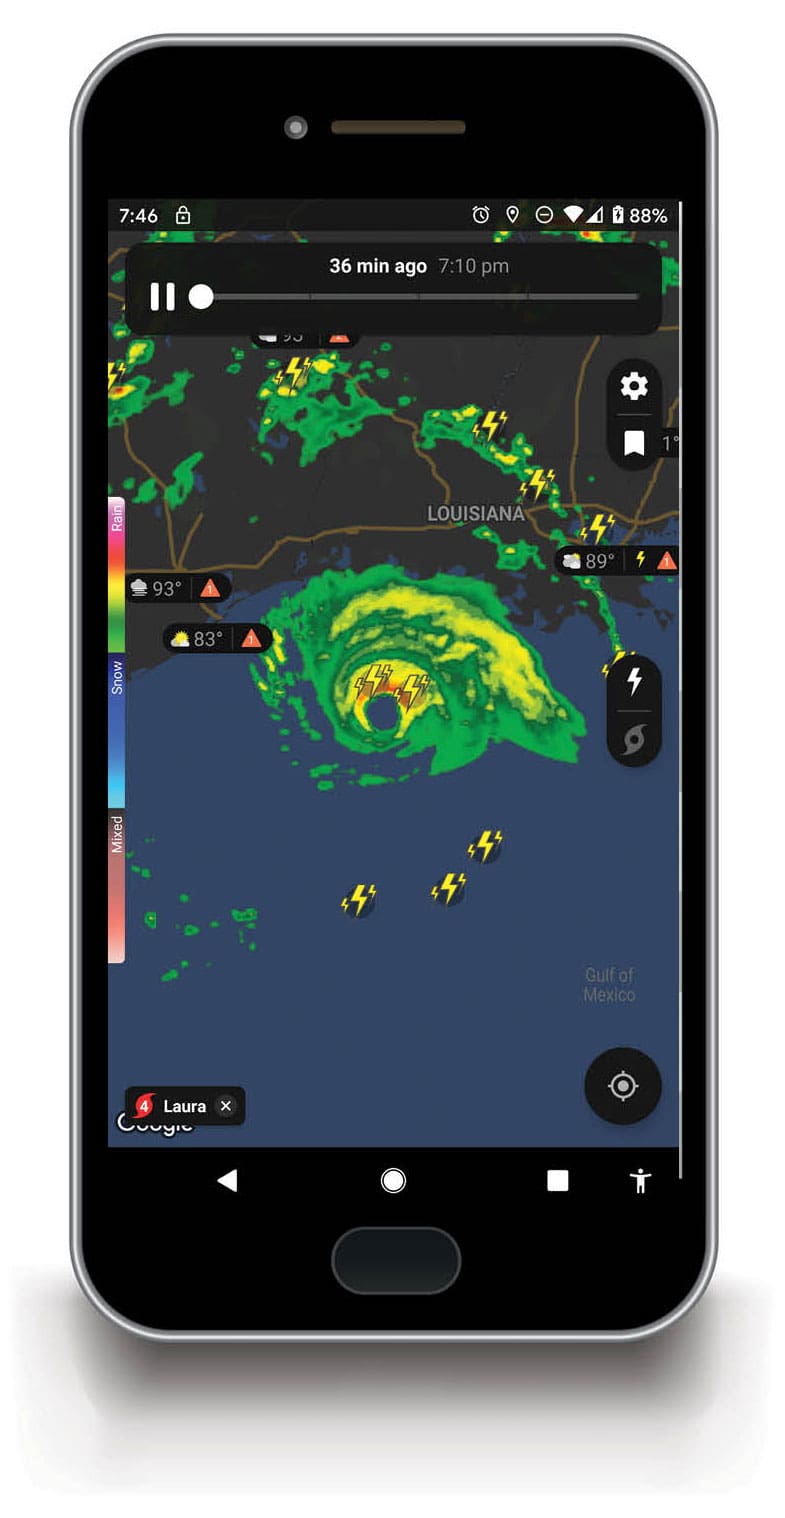
The single most useful phone app I use is radar. My current favorite is Clime’s NOAA Weather Radar (www.climeradar.com). Once again, radar apps are mostly useful in coastal cruising situations, but they can be invaluable up to 20 or 30 miles out, and if you have Internet access, they show radar much further offshore. When headed offshore it is very useful to zoom well out on the radar app to get a view of the weather systems coming up the coast or across the continent. For example, on the East Coast of the US much of the weather comes across the continent or up the coast from the Caribbean so you can get plenty of warning even days ahead of time. They are brilliant when tracking approaching tropical storms and hurricanes, providing up-to-the-minute visual observations long before the radio or TV forecasters have updated their information.
One great thing you can do with a smartphone is screenshot weather reports, charts, and any data you might need later after you’ve lost your Internet connection. I also use the note taking app on my phone to record important stuff I’ll need to leave or make port: times of high and low tide, when the current will switch, the distances between marks, a bridge schedule, the weather radio schedule and maybe the radio frequency of the harbormaster.
Despite the usefulness of smartphone apps, don’t dismiss national, regional, and local cable and broadcast weather television. No matter what port you are in there will be a TV that you can watch, and often it is in a comfy bar where you can relax and get a great idea of the big weather picture. TV weather is now must-watch viewing for sailors planning a trip, though of course they tend not to provide much information beyond the coastline. One thing I have found is that coastal marine weather broadcasts from the National Weather Service switch over to endless recorded loops about all the precautions you should be taking long before a hurricane hits, while the TV weathermen will still be providing detailed position reports on the position and track of the storm right up to and beyond the impact. Your boat’s position in relation to the track of the eye can make a big difference in how the wind direction will shift and can in turn make a huge difference in how you should prepare the boat’s lines and other gear. Also, some local weather broadcasters are very knowledgeable about their region and can provide insights on things like local flooding you won’t get from national forecasting services.
When planning and executing a voyage I use the “all hands on deck” approach to weather: watch the TV, listen to the radio, check the apps, read my emails, and then I also stick my head outside and look at the clouds, judge the wind, feel the spray. I usually tap the barometer too, though right next to it on the bulkhead there is a digital barometric readout with the trend over the past 12 hours. Each element of data adds to the rich picture of how the swirling elements of the atmosphere and oceans will impact our voyage. ν
John Kettlewell is the executive director of Sail Martha’s Vineyard and he has been sailing from Labrador to South America, and out to Bermuda for more than 45 years. He’s also the author of the Intracoastal Waterway Chartbook.