How atmospheric oscillations can affect tropical storm formation
The 2022 Hurricane Season approaches. It’s known that the La Nina atmospheric effect usually correlates with active Atlantic hurricane seasons and 2020-21 were back-to-back La Nina years! So, what are the odds of La Nina in 2022, making it an unusual three in a row?
The 2021 season generated 21 named storms, the third most for any Atlantic hurricane season, behind only 2020’s record 30 named storms. Did these back-to-back La Nina years have a common denominator? Let’s look at the El Nino/Southern Oscillation, otherwise known as ENSO.
The Southern Oscillation is specific for the periodic reversal of atmospheric pressure between two tropical meridional extremes (Tahiti/Darwin) discovered by Sir Gilbert Walker in the 1920s. Why this pressure seesaw pattern exists is an interesting story in itself; more on that later. Those pressure shifts induce wind patterns that induce surface current flows carrying heat that transfers to the atmosphere. One measure of the likelihood of a La Nina state is the Southern Oscillation Index (SOI), which relates pressure in Tahiti to that in Darwin, (SOI = T – D) measured in millibars and compared to historical averages. When the SOI is above seven millibars it is positive and consistent with La Nina. If less than seven millibars, it is negative and consistent with El Nino. In between +/- 7 the SOI is neutral. Higher in Tahiti relates to stronger easterlies, higher in Darwin, to weaker easterlies or even reversing to westerlies.
At this point it’s worth bringing up why the pressure shifts that lead to the wind shifts which come around in a circle leading to temperature gradients and back again. In short, a refrigerator and an oven.
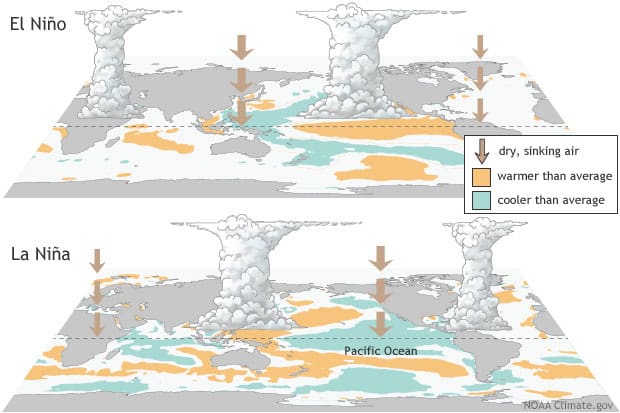
Along the western coast of the South America, the Humboldt-Peru Current courses north with cool water from the Southern Ocean, nudged along by the southeast trades, eventually brushing shoulders with the northeast trades, veering that tongue of cooler surface water gradually westward. This unloads pressure on the thermocline below (tilting the lid’s eastern rim upward), allowing colder upwelling in the eastern tropical Pacific basin. Atmospheric coupling occurs, whereby the cooler surface water cools the atmosphere, helping to maintain a higher atmospheric pressure supporting the trades. A developing La Nina phase? Half a planet away is Southeast Asia and a warm pool of ocean water, waiting to contest the oncoming cool westward current.
Looking at the globe at about 120° E on the equator shows a barrier of fractured land masses extending from the Philippines southwest to Malaysia, then veering southeast to Indonesia/New Guinea and finally a bit southwest to Australia, forming a zigzag broken land fence of sorts. This maritime continent of some 30,000 islands only partially separates the western Pacific from the Indian Ocean and includes the second and third largest islands on earth, New Guinea and Borneo (iced out of first by Greenland!). This massing of islands, atolls, and archipelagos nests in what is the most consistent, yearlong sea-surface temperature above 28° C – the Indonesian Warm Pool. Endless solar energy absorbed by land, heats a column of moist air, creating condensation as well as low pressure, inviting the easterlies that nudge warm surface water westward. Western Pacific depths reach two feet above average during the active warm cycle before rebounding eastward carrying warm water toward the South American coast. A developing El Nino?
Summarizing: the Southern Oscillation is the back and-forth, seesaw of atmospheric pressure; the Walker Circulation is the zonal wind shift resulting from those oscillating pressure gradients. Quantification of those oscillating pressures provides a path to prediction of an El Nino or La Nina. And then there’s the Oceanic Nino Index (ONI), NOAA’s primary index for tracking the ocean part of ENSO. The ONI relates the current ocean temperature to its historical average.
EN is a thermal indicator, using surface ocean temperatures in specified regions specified by longitude. Most frequently used is NINO 3.4, the equatorial rectangle between 5° N to 5° S and 120° W to 170° W. Using historical records as a reference comparison, above +0.5° C is consistent with El Nino and below -0.5° C indicates La Nina. Between those two markers, the situation is neutral. EN implies only the warm phase, one side of the oscillation, excluding the cool phase of the Southern Oscillation, known as La Nina.
The best available hints would come from those two indices mentioned above, the ONI, using the temperature trend at NINO 3.4 and the SOI. As of mid-March, and according to Climate Diver Update distributed by the Australian Bureau of Meteorology, they were:
ONI (NINO3.4) (-) 0.8° C
SOI (+) 11.0 mb
These suggest that La Nina is likely to exist well into spring. If and when these conditions subside, it would be easing back to neutral since El Nino isn’t recognized until the ONI reaches (+) 0.5 degrees or above and the SOI (-) seven millibars or below. n
Jim Austin is a freelance marine writer specializing in weather and climate and based in Vermont.